


 RADIO
RADIO


What are ATC Projections? Corbin's ATC Projections overview, including how to use ATC Projections, some of the basics, and unique features for fantasy baseball.
As someone who has played fantasy football for a lengthier period than baseball -- the roster size, league depth, and categorical balance still remains challenging in fantasy baseball. The player pool becomes difficult to master and understand, especially as the league and roster size grows.
Thankfully, projection systems help give us a baseline of numbers of what to expect before the season. Some projections systems also project players during the actual season. In this column, we'll focus on the award-winning ATC Projections by Ariel Cohen.
Many of us know about the ATC Projections since we use them during the draft process, including as part of RotoBaller's powerful Team Sync platform that will automatically adjust the projections based on your league size, categories and scoring rules. However, there's a chance we have more to learn and incorporate from ATC. Ariel Cohen created ATC Projections and has written about the projection system basics in the past. I've had the pleasure of interacting with Ariel online, and he of course would be the expert to connect with for more questions about ATC. But with that being said -- today we'll review the basics ATC Projections, discuss how to use them in our fantasy baseball draft process, and highlight the unique features.
Be sure to check all of our fantasy baseball lineup tools and resources:- Fantasy baseball trade analyzer
- BvP matchups data (Batter vs. Pitcher)
- PvB matchups data (Pitcher vs. Batter)
- Who should I start? Fantasy baseball comparisons
- Daily MLB starting lineups
- Fantasy baseball closer depth charts
- Fantasy Baseball live scoreboard
- Fantasy baseball injury reports
What Are ATC Projections? The Basics
ATC stands for Average Total Cost, and Ariel Cohen applies weights to different data sources (other fantasy baseball projection systems) based on which projection systems perform better in specific areas. For instance, if a projection system projects home runs or batting average well, Ariel may weigh that specific system more in the ATC Projections. It's similar to weighting metrics in our formal or informal process of whether it correlates well to future success.
ATC Projections have been consistently one of the most accurate projections in the industry, being awarded the top projections in the industry for five years straight (from 2019 to 2023). We'll discuss how to use them, plus other unique features to examine. The quality projection systems like ATC will test, re-test, and improve their processes over time. We can develop projections and rankings, but we should ask ourselves how much they matter if we don't refine the process.
How to Use ATC Projections?
Like any projection system, we can pull the raw stats for hitters and pitchers, including plate appearances, home runs, stolen bases, batting average, and more. We can also gather other counting stats and rates, such as walks, strikeouts, and slugging percentages.
Whether you're a drafter who relies on projections or feels, using the ATC Projections provides a starting point. To rank or sort hitters and pitchers by auction dollars, we download the ATC Projections from RotoBaller or FanGraphs. We can adjust the league size, scoring, and roster settings to customize the projected dollar values when downloading them from FanGraphs.
One may also input the ATC Projections or one of your choice and turn them into Standing Gained Points (SGP), turning into a dollar value for each player. From there, we can adjust the projections and rankings based on research or personal preference.
Last year, I also wrote an article covering ATC Projections as an overview for 2024. In this article, we'll look at the 2025 ATC Projections and filter by the unique features plus Average Draft Position (ADP) to identify notable players.
Unique Features: Inter-Projection Standard Deviation (Vol)
One aspect of ATC Projections I've used lately involves the Interprojection Volatility. Ariel asks, "How can we quantify a player's projection risk?" Previously, Ariel noted a player's Inter-Projection Standard Deviation or InterSD as one way to identify how much the various projection systems disagree on a player. The higher the InterSD means the projections vary a ton.
The visual below shows the hitters with the highest Vol within the top 200 of ADP.
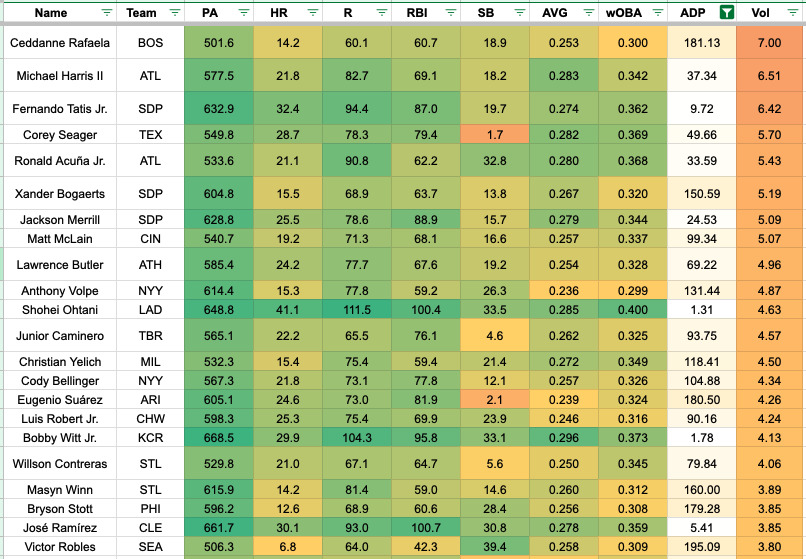
In 2025, Ariel has renamed the metrics to Vol as the new InterSD. In the visual above, we see the hitters with the highest InterSD or Vol, suggesting the projections in ATC disagree on the player's value.
When we filter by hitters inside the top 200 in ADP with the highest InterSD, the notable middle-round options include Ceddanne Rafaela, Xander Bogaerts, Anthony Volpe, Eugenio Suarez, Masyn Winn, Bryson Stott, and Victor Robles.
With Rafaela, the defense has been the calling card, helping to lock him into the lineup if he can produce offensively. In Rafaela's first full season, he had 15 home runs, 19 stolen bases, and a .246 batting average in 571 plate appearances. That's similar to the ATC Projections for Rafaela, though the concerns surround his plate discipline and mediocre power.
Volpe went from 21 home runs, 24 stolen bases, and a .209 batting average in 601 plate appearances in 2023 to 12 homers, 28 steals, and a .243 BA in 688 PA in 2024. Volpe saw volume in his first two seasons, with slight improvements in contact rate and speed, yet saw a dip in his power skills.
Like Rafaela, Winn has shown some defensive skills, possibly suggesting a safer role in the lineup. Winn showed above-average plate discipline skills, with an 81 percent contact rate and near-elite levels of zone contact at 90.5 percent.
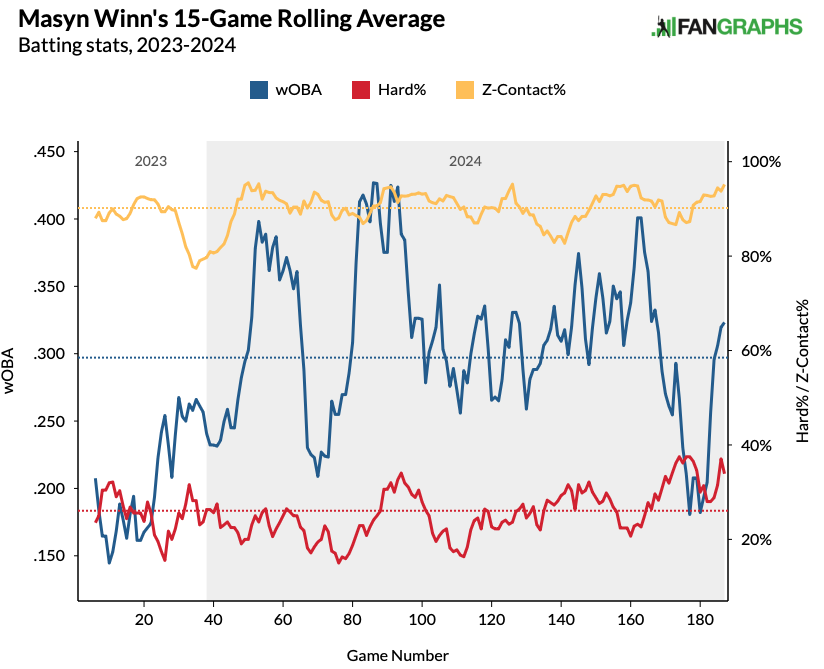
The power skills will lag with a 78 xPX and 2.8 percent barrels per plate appearance rate in 2024. Winn's strong plate discipline skills balance out the below-average power output. As a shortstop with a strong arm and 84th percentile Outs Above Average, Winn possesses the speed to steal 10-15 bags, which would be the floor.
However, the one concern involves his 68 percent stolen base conversion rate in his career, with a 10 percent opportunity rate. Regardless, Winn's profile entices us because the probable outcome would be 15 home runs, 15 stolen bases, and a .260-ish batting average, with a ceiling outcome of 20 homers and 20 steals. Make Winn a target around pick 150.
There have been ups and downs with Stott. However, it's hard to fade a hitter averaging 13 home runs and 31 stolen bases over the past two seasons. Like Winn, Stott showed above-average plate discipline, with an 81 percent contact rate and 88.8 percent zone contact rate.
The visual below shows the pitchers with the highest Vol within the top 200 of ADP.
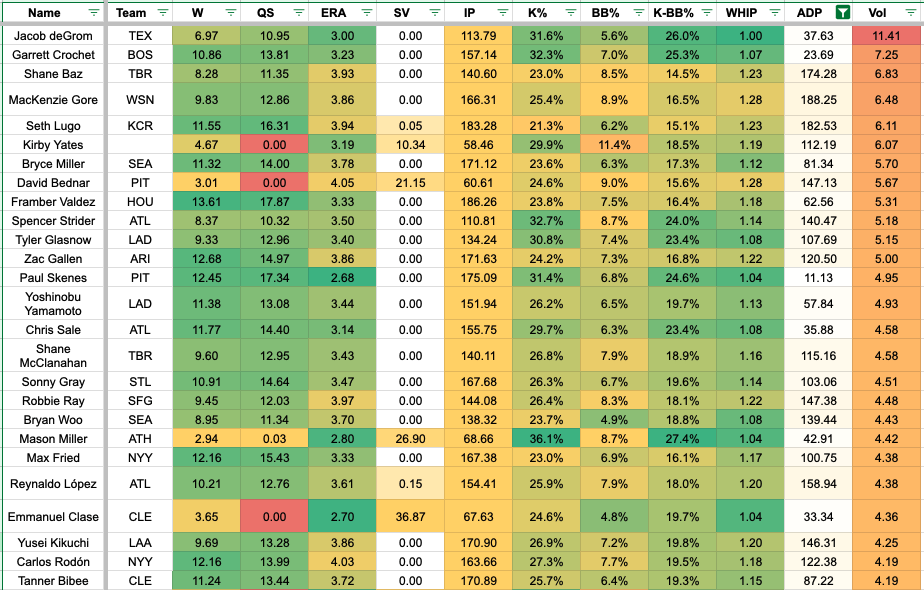
The pitchers with the highest Vol have several pitchers with injury concerns, aligning with the projection variance. Among starting pitchers, those pitchers include Jacob deGrom, Garrett Crochet, Shane Baz, MacKenzie Gore, Seth Lugo, Bryce Miller, Framber Valdez, Spencer Strider, and Tyler Glasnow.
deGrom had three starts in September, averaging a 97.7 mph fastball velocity, over one mph lower than his average since 2019. Besides deGrom's curveball, the other pitch movement profiles haven't changed, though we're dealing with small samples.
The ADP remains high as a second to third-round pick (37 ADP), meaning fantasy managers will need to pay up for the uncertainty of his dominance with a projected higher workload of over 100 innings since 2019.
Let's touch on Gore since he has one of the lower ADPs based on the starting pitchers with the higher Vol. Gore increased his workload in 2024, with slight improvements in ERA but still a brutal WHIP. Gore's 3.90 ERA aligned with his xERA (3.96), meaning the skills supported the output.
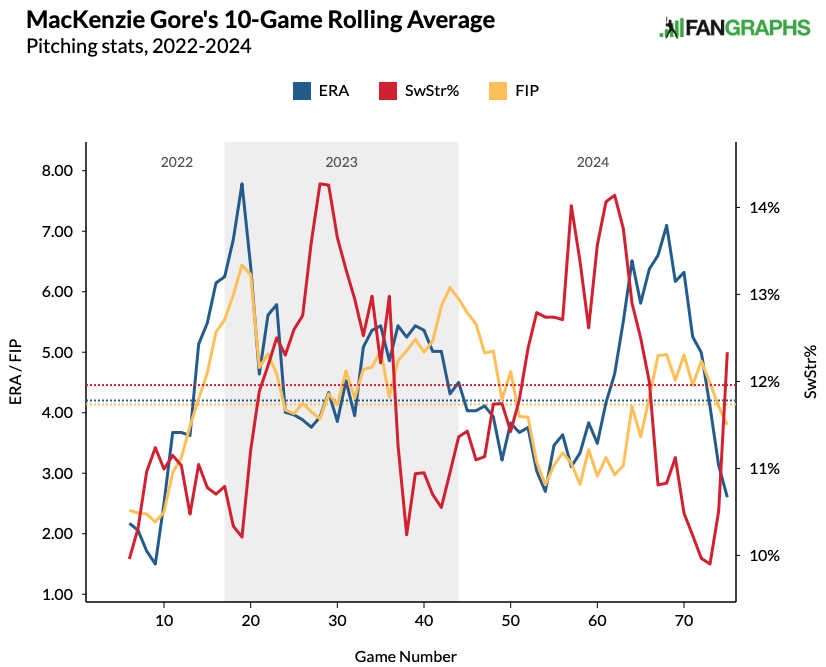
The swinging-strike rate has gradually increased from 10.9 percent in 2022 to 12.5 percent in 2023 and 13 percent in 2024. However, Gore's WHIP challenges come from allowing a high hit rate, with a career average of 35 percent. The control is mediocre, with a 35.8 percent ball rate.
Gore has shown above-average skills and should be valued as a streaming pitcher with some upside around an ADP of 185 to 200 based on the recent draft trends.
Unique ATC Features: Intra-Standard Deviation (Dim)
While InterSD looks at the volatility between the projection systems, Intra-Standard Deviation or IntraSD determines the potential unpredictability of a player's profile. A smaller IntraSD means the player has more of a balanced profile, contributing in multiple categories. Meanwhile, a bigger IntraSD shows a player with more unbalanced categories.
We noted earlier that Ariel Cohen adjusted InterSD to be Skew on the spreadsheet. Ariel renamed IntraSD to Dim. However, it appears a higher Dim means the projections suggest the player should have a balanced profile.
The visual shows the hitters with the highest Dim among players within the top 200 in ADP.
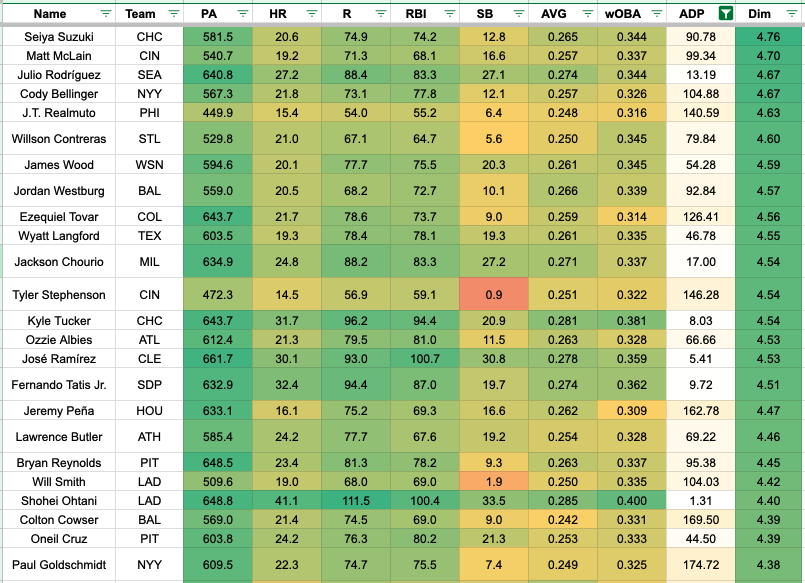
That's evident in seeing Seiya Suzuki, Matt McLain, Julio Rodriguez, Cody Bellinger, J.T. Realmuto, Willson Contreras, James Wood, and Jordan Westburg among the hitters with the highest Dim. Theoretically, these hitters should provide power, speed, batting average, and juice across multiple categories.
Unsurprisingly, most of these hitters with the highest Dim have an ADP inside the top 150 picks because fantasy managers have been prioritizing them. McLain and Bellinger have balanced profiles, but the projection systems seem to disagree on them via the Vol, making for a tough decision. That's especially true with McLain missing the 2024 season due to shoulder surgery and rib injuries.
The visual below shows the pitchers with the lowest Dim.
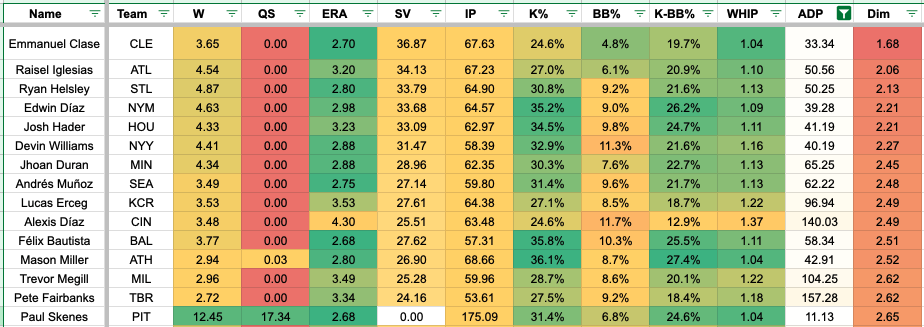
Unsurprisingly, many pitchers with a lower Dim are closers because they don't have a balanced profile. Among relievers, one could argue they have balanced profiles via saves, strikeouts, ERA, and WHIP. However, they lack innings and wins in most cases.
The pitchers below have the lowest Dim among players within the top 200 in ADP.
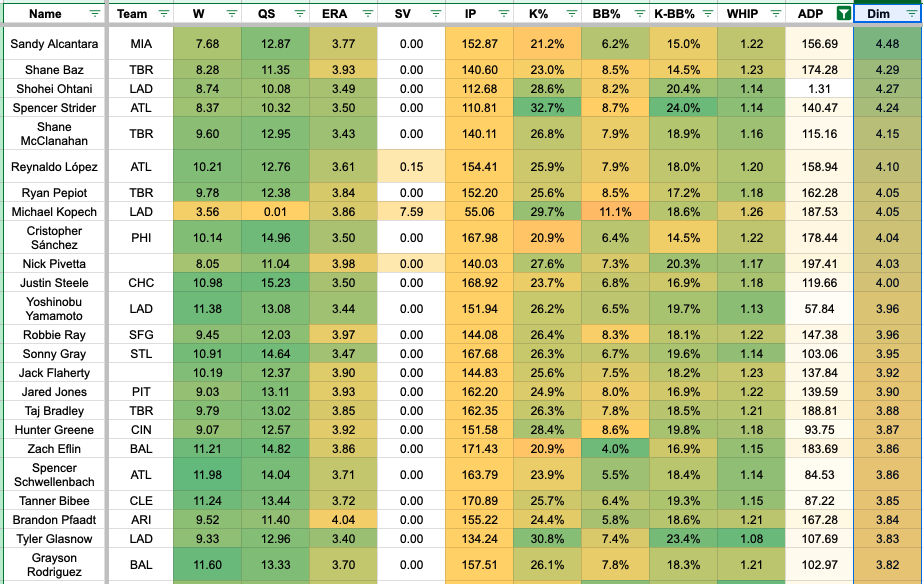
Meanwhile, the pitchers with the highest Dim have polarizing names. The list includes Sandy Alcantara, Baz, Shohei Ohtani, Strider, Shane McClanahan, and Reynaldo Lopez inside the top 200 picks. Besides Lopez, the rest of those pitchers have significant injury and workload concerns in 2025, though we can't deny the skills when healthy.
The only reliever of note with the highest Dim was Michael Kopech, though it's likely because of the wins, saves, and strikeout projections. It's worth noting that Kopech's ADP is a middle-round pick near 190, so the risk is built into the cost with the additions of Kirby Yates and Tanner Scott in January 2025.
ATC Projections Summary
It's wild to think we have so many projection systems to use in our fantasy baseball draft and season-long preparation. Be cautious when thinking we may know better than the projections. As the saying goes, if we think we know everything, we probably don't know anything.
One topic that comes up involves playing time if we project more or less volume. It's easy to love or dislike a player's skill set and think an outcome is highly probable.
Some projection systems tend to be conservative instead of upside expectations, and ATC fits that mold. Beyond rankings and projected values, ATC Projections can help us find potential volatility and categorical balance to consider in the roster-building and drafting process. Like anything, use ATC Projections as a starting point to dive deeper into a data-heavy sport like fantasy baseball.
Download Our Free News & Alerts Mobile App
Like what you see? Download our updated fantasy baseball app for iPhone and Android with 24x7 player news, injury alerts, sleepers, prospects & more. All free!

More Fantasy Baseball Advice
draft