


 RADIO
RADIO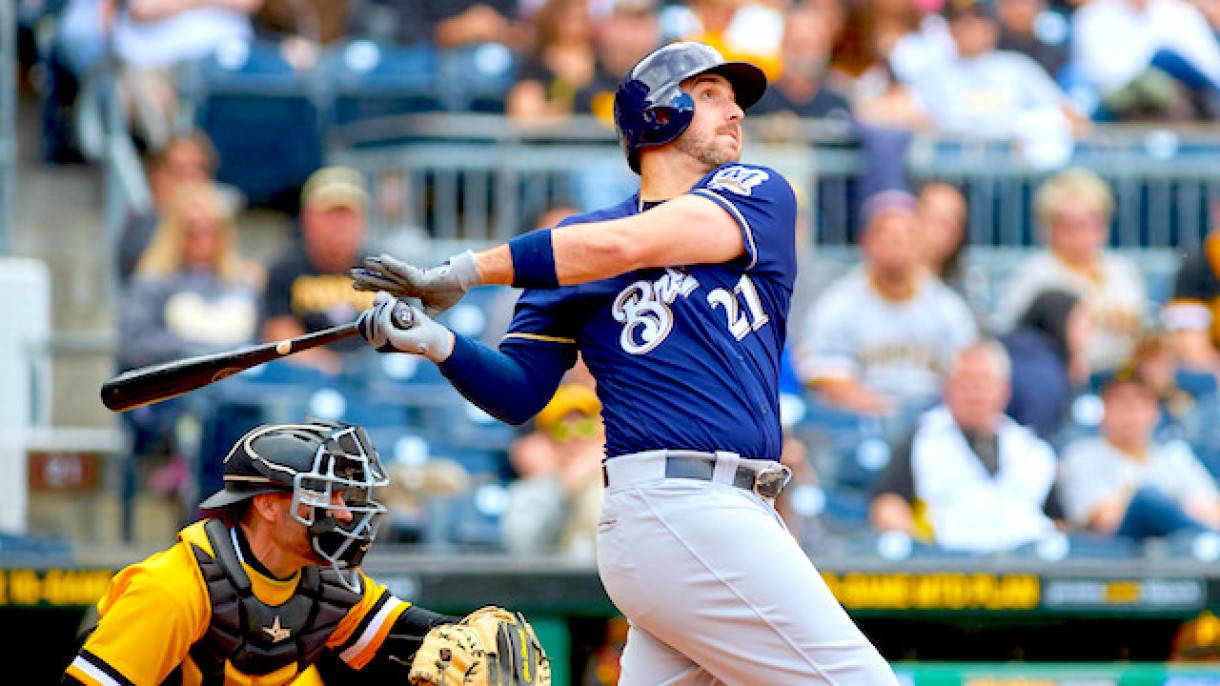
Pierre Camus examines the notion that second-half stats are different from the first half of the MLB season for fantasy baseball purposes.
We must mentally brace ourselves for the darkest period of the calendar year - three days without a Major League Baseball game and one day without a regular-season game from any of the major professional sports. As fans, we hate the break. The players understandably love it and have been looking forward to the time off for quite a while.
Fantasy managers often declare this the advent of the "other season" since much can change over the second half compared to how the season began. This got me thinking - just how much do things change in the second half and how?
The deeper question is: do we put too much emphasis on first-half/second-half splits, looking for patterns that may not even exist?
Featured Promo: Save 50% off the regular price with discount code SUMMER, for a limited time. Exclusive access to our Team Sync platform, DFS cheat sheets, Lineup Optimizers, betting/prop picks, and exclusive content from Nick Mariano and Eric Cross! GAIN ACCESS NOW
Offensive Output
I played around with the Splits Leaderboard on Fangraphs to see what hitting ratios might show statistically significant variances from the first half of the season to the second half over the past five full seasons (a.k.a. the Manfred era). Not to sound like a broken record, but 2020 will be excluded for obvious reasons. It's not just me either, folks.
How would you handle 2020 “First Half” and “Second Half” splits?
For normal seasons, the “First Half” are games before the All Star Game and “Second Half” are games after the ASG.
— Jeremy Frank (@MLBRandomStats) June 22, 2021
So, examining 2015-2019 divided by league to account for that pesky DH rule, here's what I found, beginning with league batting averages.
| Season | League | AVG - 1st half | AVG - 2nd half | Difference |
| 2015 | AL | .253 | .258 | -.005 |
| 2015 | NL | .253 | .254 | -.002 |
| 2016 | AL | .260 | .253 | .008 |
| 2016 | NL | .253 | .255 | -.002 |
| 2017 | AL | .256 | .256 | .000 |
| 2017 | NL | .254 | .255 | -.001 |
| 2018 | AL | .248 | .251 | -.003 |
| 2018 | NL | .246 | .247 | -.001 |
| 2019 | AL | .252 | .254 | -.002 |
| 2019 | NL | .251 | .251 | .000 |
Batting average barely changed, if at all, over the course of the second half. Any notion that offense increases after the All-Star break as pitchers fatigue or the weather gets warmer is simply not true.
| Season | League | BB% - 1st half | BB% - 2nd half | Difference | K% - 1st half | K% - 2nd half | Difference |
| 2015 | AL | 7.58% | 7.78% | -.20% | 19.84% | 19.99% | -.15% |
| 2015 | NL | 7.43% | 7.93% | -.50% | 20.47% | 21.37% | -.91% |
| 2016 | AL | 8.01% | 8.00% | .01% | 20.57% | 20.97% | -.40% |
| 2016 | NL | 8.35% | 8.34% | .00% | 21.46% | 21.52% | -.06% |
| 2017 | AL | 8.58% | 8.20% | .38% | 21.49% | 21.22% | .27% |
| 2017 | NL | 8.51% | 8.88% | -.37% | 21.67% | 22.22% | -.55% |
| 2018 | AL | 8.24% | 8.34% | -.10% | 22.01% | 21.74% | .27% |
| 2018 | NL | 8.89% | 8.34% | .55% | 22.52% | 22.75% | -.23% |
| 2019 | AL | 8.57% | 8.38% | .19% | 22.67% | 23.32% | -.66% |
| 2019 | NL | 8.45% | 8.69% | -.24% | 22.85% | 23.10% | -.26% |
Plate discipline wasn't much different either. There are slight bumps or dips here and there but they are minor and don't follow any discernable pattern. Batters didn't show more or less patience at the dish. If anything, this just reinforces the known fact that strikeout rates have been steadily rising each year and aren't showing any sign of slowing down.
Finally, let's see if power surges or gets sapped during the stretch run in any way.
| Season | League | SLG | SLG | Difference | HR/FB | HR/FB | Difference |
| 2015 | AL | .402 | .424 | -.022 | 11.0% | 12.4% | -1.4% |
| 2015 | NL | .390 | .405 | -.015 | 10.4% | 11.8% | -1.4% |
| 2016 | AL | .427 | .418 | .009 | 13.0% | 13.0% | .0% |
| 2016 | NL | .412 | .412 | .000 | 12.8% | 12.3% | .5% |
| 2017 | AL | .427 | .431 | -.004 | 13.7% | 13.8% | -.1% |
| 2017 | NL | .424 | .422 | .002 | 13.7% | 13.5% | .2% |
| 2018 | AL | .413 | .419 | -.005 | 12.8% | 13.0% | -.2% |
| 2018 | NL | .401 | .406 | -.005 | 12.6% | 12.8% | -.2% |
| 2019 | AL | .435 | .444 | -.010 | 14.9% | 15.8% | -.9% |
| 2019 | NL | .430 | .432 | -.003 | 15.3% | 15.3% | .0% |
Again, the answer is: not really. There was a noticeable dip in slugging back in 2015 but otherwise there is nothing we can point to that says slugging rates will change appreciably. Balls didn't leave the yard at a different rate either.
One unique twist to 2021 is that we will be measuring offensive output in a new type of split: pre-sticky stuff and post-sticky stuff. Sabermetric statistician Jon Anderson has already begun that task by examining the biggest risers and fallers in strikeout rate since June 21, which is when the MLB sticky substance crackdown was officially put into effect. This policy may cause pronounced splits for certain players and even a leaguewide decline in strikeout rates for the first time in forever. It's too early to make that assumption but early returns seem to indicate so.
Looks like the MLB's sticky stuff crackdown is working: https://t.co/2NYaKxyi93 pic.twitter.com/iKhISdBfMn
— Sports Illustrated (@SInow) June 29, 2021
Player Splits
Do specific players perform far better or worse in the second half of the season on a consistent basis? Sure. Travis Shaw always jumps to mind for me. In 2016, he had a solid first half with a .269 average, nine HR, 48 RBI, 42 R, and looked like a solid corner infield option for the remainder of the season. Then he batted 75 points lower (.194) with half as many runs and RBI and was drop material. In 2017, it was a similar story when he went from .299 to .242 and drove in 29 fewer runs in 12 fewer games over the second half.
There are many incidents of players inexplicably falling off a cliff after the All-Star break and vice versa. The extended time off and sudden awakening to the fact the season is more than half gone can put a charge into a player, especially one headed for free agency. The intention of this article is not to identify such players. This is about the bigger picture, after all.
Today's moral is that while splits do exist on a micro level for specific players or teams, there are a variety of circumstances that lead to those changes. Injuries are first and foremost on the list. Trades made in the weeks right after the second half gets underway will make drastic changes to a player's production. For those who remain in the same context as far as team, batting order, playing time, health, and most of the other important factors that should be considered, there is no reason for the second half to come out any differently.
If anything, this is a good reminder to take a close look at the ripple effects of each trade that will be made and think deeply about how each team will approach the second half of the season. If a player's production rises or falls drastically after the break, there's probably a good reason other than the fact that the second half has begun.
Download Our Free News & Alerts Mobile App
Like what you see? Download our updated fantasy baseball app for iPhone and Android with 24x7 player news, injury alerts, sleepers, prospects & more. All free!

More Fantasy Baseball Advice