Jon Anderson takes a look at the 2023 fantasy baseball hitter projections and sees where certain categories are concentrated across the ADP.
If you're drafting a fantasy baseball team in a rotisserie-style league, how you attack the different categories is almost just as important as what players you draft. There are five standard categories:
- Runs
- Home Runs
- RBI
- Stolen Bases
- Batting Average
You can put together a team that laps the field in home runs but still finish last in the league if you stink in the other four categories.
I'm here today to help you get a feel of where the hitting statistics are distributed. This is a big topic of conversation during draft season, and those who best understand it definitely get a little bit of an edge.
Be sure to check all of our fantasy baseball draft tools and resources:- Fantasy baseball draft kit
- Fantasy baseball rankings
- Team Sync platform and Draft Assistant
- Fantasy baseball mock draft simulator
- Fantasy baseball draft cheat sheets
- Fantasy baseball closer depth charts
- Fantasy baseball prospects
Methodology
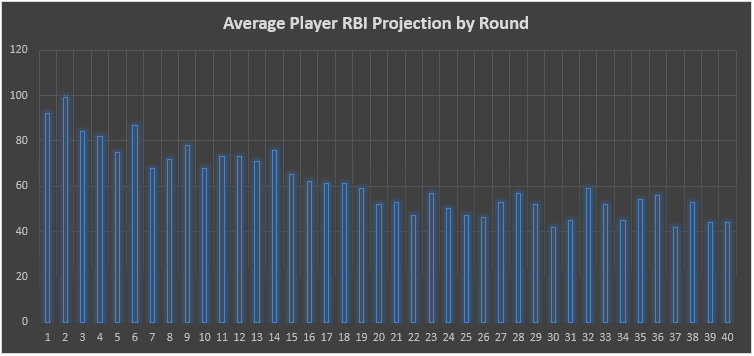
For this post, I'm going to use an aggregation of different projection systems, and then group hitters together by round - assuming a 12-man league. What you will see below are a bunch of "average player projections by round," and then you'll have a round number 1-40 with a number with it for each category. The first round then would be the top 12 ADP. The second round would be ADP 13-24, and so on and so forth. Let's have at it!
Steals
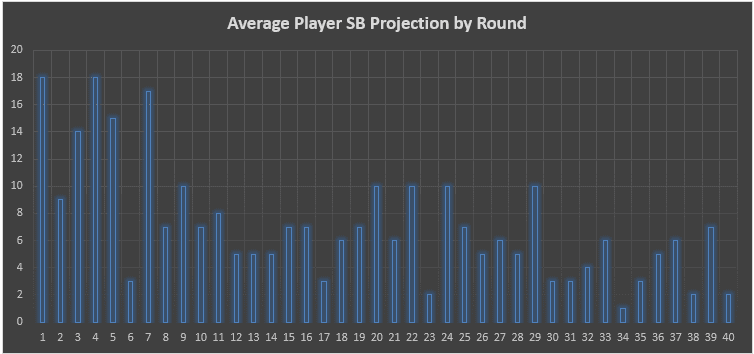
We are starting with steals because this is typically the "most scarce" statistic of the big five. We see that it's somewhat front-loaded again in 2023, but what we do notice is that it's much more evenly distributed this year as compared to last season.
I did this same study last year, and I found that 27% of the projected steals in the top 30 rounds were in Rounds 1-3. This year, that number has dropped to 17%. That's a pretty big difference. Here are the top 10 steals projections and the round they go in most commonly:
| Player | SB | Round |
| Ronald Acuna Jr. | 35 | 1 |
| Adalberto Mondesi | 33 | 20 |
| Cedric Mullins II | 30 | 5 |
| Jake McCarthy | 30 | 10 |
| Tommy Edman | 28 | 7 |
| Bobby Witt Jr. | 28 | 1 |
| Randy Arozarena | 28 | 4 |
| Trea Turner | 28 | 1 |
| Starling Marte | 28 | 7 |
| Jazz Chisholm Jr. | 27 | 4 |
Projecting steals is tougher this year than others, I will admit that. There are new rules in play concerning pitcher pickoff attempts, pitch clocks, and bigger bases as well. I expect steals to come up 10-20% overall, and I don't think it will apply evenly to everybody. The guy that ran all the time last year will still run all the time, there's not a lot of room for growth there.
The players that never ran probably won't run this year either, so that leaves the middle of the player distribution benefiting the most. I can't say with confidence who is going to benefit, and I might have this all wrong - but I do think the smart approach this year is to draft a bunch of 5-15 steals guys rather than just a couple of 30+ guys. Of course, drafting steals in the first round is still a perfectly good thing to do, but I am a bit more comfortable with a Yordan Alvarez type in the first round this year.
Later-round steals to consider:
- Jake McCarthy
- Tommy Edman
- Andres Gimenez
- Esteury Ruiz
- Nico Hoerner
- Harrison Bader
- Tim Anderson
- Whit Merrifield
- Thairo Estrada
Home Runs
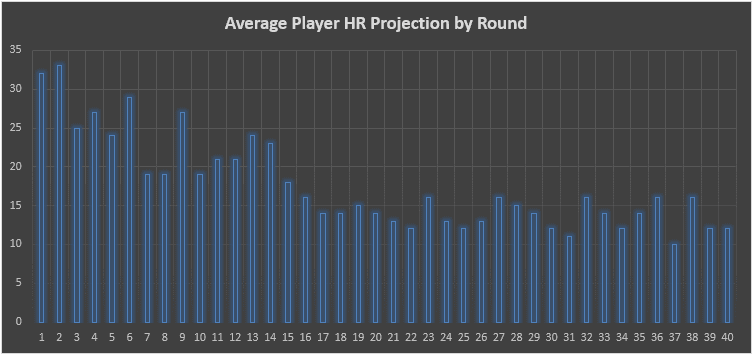
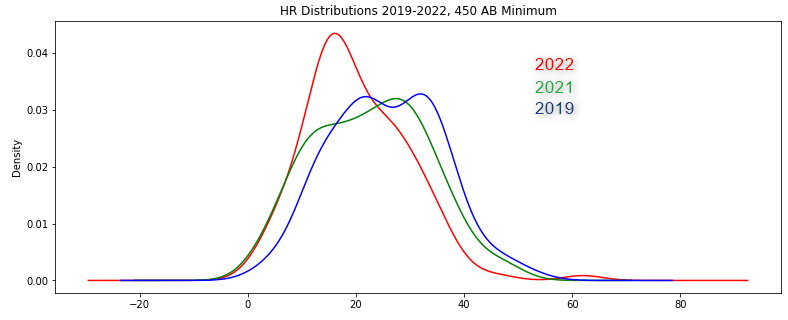
Home runs have been trending downward since 2019. Here are some numbers on that. I show each of the last three full seasons along with the league home run rate and the number of hitters that went over certain thresholds:
| Year | AB/HR | 30 HR | 25 HR | 20 HR |
| 2019 | 31.25 | 58 | 80 | 129 |
| 2021 | 27.24 | 43 | 70 | 102 |
| 2022 | 24.62 | 23 | 45 | 71 |
Home run rarity went to new heights last year, and that resulted in a lot of guys being concentrated right in the 15-20 range.
The average exit velocity of a home run in 2019 was 102.4 miles per hour. In 2021 and 2022, that average came up to 104.2. It is now tougher to hit a home run. That means the middle-round guys are less likely to hit them, and the homers will be more concentrated into the league's strongest players.
We are looking for hitters with high Brl/PA rates. Here are the top 20 hitters from a year ago in that category along with their 2023 ADP and projected PAs for 2023:
Of the top 10 guys here, only three are making it out of the third round. Those names are Stanton (health concerns), Mountcastle (Camden Yards), and Joc Pederson (platoon concerns). It's not easy to find trustworthy home run hitters after the first 50 picks.
This might be a little bit of reason to lean closer towards Rodriguez, Alvarez, and Judge over guys like Trea Turner and Jose Ramirez who probably top out around 25 homers. You may even consider going double power bats to start your draft (Rodriguez and Alonso, for example). It just might be easier to catch up in steals later in the draft than catch up in long balls. What a twist!
Later-round homer guys to consider:
- Giancarlo Stanton
- Ryan Mountcastle
- Joc Pederson
- Teoscar Hernandez
- Rowdy Tellez
- Seth Brown
- Anthony Santander
Batting Average
I have come to believe that it's best to more or less not draft for batting average. The statistic is quite noisy year to year. I checked the correlations for the five roto categories from 2021 to 2022 - using RATES rather than totals so injuries aren't factored in. Here are those correlations:
| Category | Correlation |
| Runs | .51 |
| Homers | .67 |
| RBI | .53 |
| Steals | .71 |
| AVG | .49 |
The somewhat reliable statistics here are homers and steals. We can project runs and RBI a bit better than this suggests because those two categories are so dependent on team and lineup context, which we can have a decent feel for ahead of the season. Batting average, however, is completely on the individual player - so the low correlation there means a bit more.
That is not to say that we have no power to know what a player's batting average will be. The key inputs to batting average are strikeout rate and quality of contact, and those two things are much more sticky from year-to-year, so we can take those stats seriously. We can feel quite confident that Luiz Arraez will hit for a strong batting average and that Joey Gallo will not, for example. But there's a lot more noise in the middle of the player distribution than we often think.
My general strategy in roto drafts is to avoid the high strikeout hitter (27%+). This angles me toward a competitive batting average since I'm not taking the Eugenio Suarezs and Giancarlo Stantons of the world who will bring my batting average down just because they're giving away a third of their PAs to the strikeout. Of course, there is a time and a place for those types of players (namely when you started with a bunch of steals and typically high batting average guys and need to catch up in power in a hurry), but my ideal draft would not contain those types.
If I can get a lineup full of players with strong strikeout rates and at least decent power, I won't need to think twice about the batting average category, I will just let the cards fall where they may and embrace the randomness. That doesn't always work out though, so here are some cheap batters we can feel good about in the batting average category:
- Michael Brantley (ADP 406)
- Luis Arraez (206)
- Alex Verdugo (199)
- Jeff McNeil (180)
- Yandy Diaz (285)
- Nico Hoerner (142)
- Amed Rosario (127)
- Harold Ramirez (425)
- Ty France (169)
- Andrew Benintendi (222)
The more expensive guys on that list happen to be guys that will either steal 20+ bags or hit 15+ homers. The cheaper ones pretty much only give you batting average, so I would recommend not putting yourself in the situation where you have to draft a Brantley or Ramirez to get some base hits into your lineup.
Runs & RBI
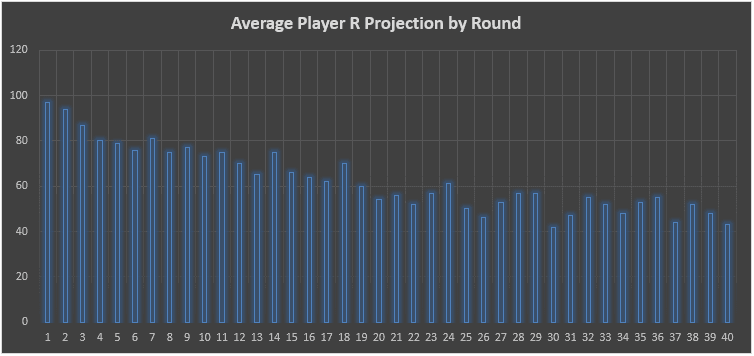
These two things are somewhat tough to predict as well, as we saw above with the low correlation rate. Most of the runs and RBI projections have to do with projected plate appearances, projected lineup spot, and what team the player is on.
I don't have a ton else to say about these two categories. They fall pretty steadily as the draft goes on. This is mostly because you're losing playing time and power as you get deeper and deeper into a draft, and those two things are super important to racking up runs and RBI.
For runs, you are looking for players hitting at the top (#1 or #2) of the lineup. Here are the average percent boosts that each lineup spot saw in run-scoring last year:
| Spot | Boost |
| 1 | +13% |
| 2 | +6% |
| 3 | -4% |
| 4 | -7% |
| 5 | -6% |
| 6 | -6% |
| 7 | -5% |
| 8 | +2% |
| 9 | +6% |
These numbers are per-total base. Once you factor in the loss of PAs you encounter from hitting #8 or #9 in the lineup, that boost goes away entirely. But you would expect significantly more runs scored per total base from a #9 hitter as compared to a cleanup hitter, for example.
Okay, here are the best run projections after pick #200:
- Luis Arraez (83)
- Yandy Diaz (79)
- Ketel Marte (75)
- Brendan Rodgers (71)
- Ryan McMahon (70)
- Austin Hays (70)
- Mike Yastrzemski (69)
- Miguel Vargas (68)
- Andrew Benintendi (68)
- Ramon Laureano (67)
- J.D. Martinez (67)
- Austin Meadows (67)
Shifting to RBIs:
More of the same. Here are those per-total base lineup spot boosts for the RBI category:
| Spot | Boost |
| 1 | -18% |
| 2 | -5% |
| 3 | +7% |
| 4 | +13% |
| 5 | +9% |
| 6 | -2% |
| 7 | -2% |
| 8 | 0% |
| 9 | -2% |
You can see the toll leading off a game takes on your RBI total. If you're leading off, you need to hit a homer to drive in a run in at least 20% of your plate appearances (leading off the game for your team). That's the only lineup spot where that's true. It also hurts that you follow the worst hitters on your team, the #8 and #9 players, so even when you're not leading off the game, it's much less likely that you'll have men on base.
The big boosts come at the #3 and #4 spot - with the #4 spot really taking the cake here. We don't have a great idea about what Opening Day lineups will look like right now, but you can use the above data to upgrade or downgrade hitters once those lineups start becoming more clear.
Let's finish this beast out with the highest RBI projections after pick 200:
- Joc Pederson (76)
- Ryan McMahon (76)
- J.D. Martinez (74)
- Justin Turner (72)
- Anthony Rendon (70)
- Riley Greene (69)
- Seth Brown (69)
- Yoan Moncada (67)
- Brendan Rodgers (65)
- Ketel Marte (64)
That's it for this piece! I hope you enjoyed it, and I hope it helps your drafting. Let me know if you have any questions on Twitter @JonPGH.
Download Our Free News & Alerts Mobile App
Like what you see? Download our updated fantasy baseball app for iPhone and Android with 24x7 player news, injury alerts, sleepers, prospects & more. All free!

More Fantasy Baseball Advice


 RADIO
RADIO


