Things finally got serious. If you're here, it's only because one of two reasons: 1) you have followed the series all along and want to keep reading just so you don't feel bad with yourself, or 2) you won your first round of the fantasy playoffs and are still on the lookout for the smallest of tidbits that can help you gain an edge over your next opponent and make it to the final. No matter what, I'm here to help you both get entertained and win your matchups. You are limited now with only two weeks to go. Trades are a non-factor. The waiver wire is drained of talent. But there are still things to know that can help you make the decision that ultimately gets you that coveted W and gets you closer to the trophy in Week 16.
To gain the biggest edge in your fantasy football league, it's necessary to understand how to apply the advanced statistics being used in sports nowadays. Back in the day, it was all about wins and losses, passing yards, and touchdowns scored. It's not that those stats are now worthless, they just don't offer enough information to savvy analysts. While football is still in its infancy compared to baseball in terms of analytics, the evolution the sport has seen lately in those terms is notable.
Each week, I'll be tackling NFL's Next Gen Stats, bringing you data from the previous week's games with notable takeaways you should consider when assessing fantasy players for the upcoming week. In case you're new to the series, or Next Gen Stats altogether, I recommend you read our preseason primer. Now, let's get to the data!
Be sure to check all of our fantasy football rankings for 2025:- 2025 fantasy football rankings (redraft)
- Dynasty fantasy football rankings
- 2025 NFL rookie fantasy football rankings
- Best ball fantasy football rankings
- Quarterback fantasy football rankings
- Running back fantasy football rankings
- Wide receiver fantasy football rankings
- Tight end fantasy football rankings
State of WR/TE After the First Playoffs Round - NextGenStats
With the playoffs already started and fantasy owners fighting for that championship, it's time for the final round of statistical analysis based on NextGenStats data starting with the receiving corps.
We'll go through wide receivers here, and later cover rushers and quarterbacks after the second round and the final game of the playoffs. Today, I'll present each of the stats from the NFL's advanced metrics site, its correlation with receiver fantasy points, and a list of leaders and trailers in each category along with some notes and takeaways on both the players' and the metrics' impact on fantasy as a whole.
So let's dive in. Note: The cutoff is set at 35 targets for both WR and TE.
Cushion / Separation
Correlation with Fantasy Points: negative-1% / negative-21%
Leaders and Trailers:

Leaderboard Notes:
- I have sorted the leaderboard by SEP just because it has a little higher relationship with fantasy points. As you can see, most of the players with high SEP values are tight ends. That comes down to them not being covered as tightly as other, more skillful receivers. Also, tight ends are often used as security blankets, so they're thrown passes only when they're quite open.
- As already was the case three weeks ago, most of the highest SEP values are attached to tight ends, which is reasonable considering they are often less dangerous and can be given more space. While this has been the case for the best TE of the year on FP/G (Austin Hooper, SEP 3.9), it has not held for other good players at the position like Travis Kelce (3.0), George Kittle (3.0), and Zach Ertz (2.7).
- Only five tight ends are averaging CUSH marks at or over 6.0: Mark Andrews (6.0), Zach Ertz (6.0), Ryan Griffin (6.3), Nick Boyle (6.4), and Jacob Hollister (7.1). That less significant compared to the 37 wide receivers with such marks, led by Robert Woods (7.5).
- The other side of the CUSH leaderboard is a little more balanced, although not by that much. Three tight ends have CUSH marks at or under 5.0 (George Kittle, Blake Jarwin, Dawson Knox) while 14 wide receivers have such marks. The lowest CUSH among WR belongs to Robby Anderson at 4.2, followed by Preston Williams and John Brown (4.5).
- Only two tight ends are averaging more than 15 FP/G on the season (Austin Hooper and Travis Kelce), but they have very separated values in both CUSH and SEP, which proves the low relation of those metrics with actual fantasy scoring.
- Something similar happens with the top receivers. Michael Thomas and Chris Godwin post the highest fantasy points per game, yet Thomas has a 5.4 CUSH to Godwin's 6.5. Cooper Kupp averages a bit fewer points (he is still WR7 though) and his SEP is of 3.3 compared to Thomas' 2.6 and Godwin's 2.8. Again, nothing really meaningful is present in this couple of data points.
Correlation with Fantasy Points: 27% / 66%
Leaders and Trailers:

Leaderboard Notes:
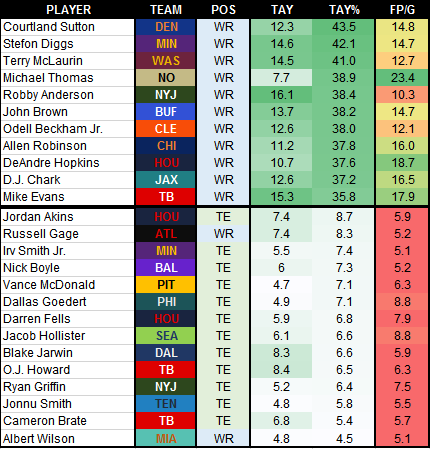
- Opportunity trumps everything in fantasy football, and it can be seen in the highly related link between the percentage of yards a team/QB throws toward a player and the fantasy point he scores.
- This is made clear by the table above, which I have sorted by Targeted Air Yards% (among teammates). Every player shown at the top of the table (and in fact, every player with a TAY% of 30 or higher) is averaging double-digit fantasy points this season.
- Chris Conley is the first player to average fewer than 10 FP/G (9.0) with the highest TAY% at 29.1 percent. He's just ahead of James Washington (9.4) who has a 28.7 TAY%.
- At the other end, no wide receiver nor tight end is averaging double-digit FP/G with a TAY% under 10. John Ross is the first one to make the cut (14.3 PF/G) while having a 10.1 TAY%. The next player of that profile would be Evan Engram (13.7) with a low 11.1 TAY%, followed by Austin Hooper (16.0) with a TAY% of 11.7.
- Mark Andrews is the tight end with the highest share of air yards, having a 28.9 percent so far. Kelce is second with 26.1 TAY% and lastly, Darren Waller (25.5%) and Zach Ertz (25.3%) are the only other two even remotely close to those marks, with no other TE getting a 20% share.
- Also through 14 weeks, just three WRs have a share under 10%: Albert Wilson (4.5 TAY%), Russell Gage (8.3), and Mecole Hardman (9.2).
Receptions / Targets / Catch% / Touchdowns
Correlation with Fantasy Points: 80% / 76% / 36% / 68%
Leaders and Trailers:

Leaderboard Notes:
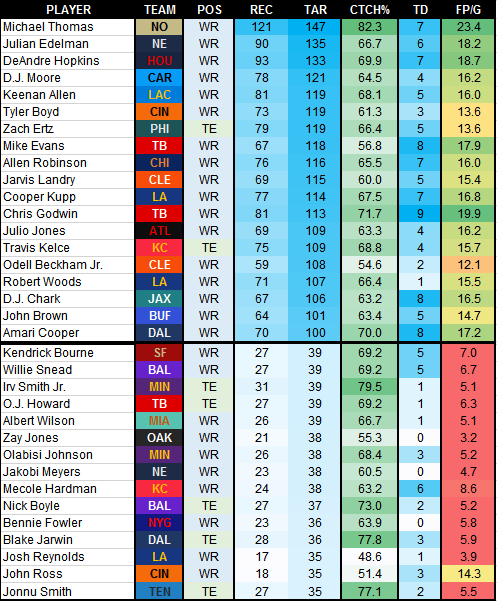
- Can we crown Michel Thomas already? This guy is breaking every possible football limit known to man. With three games to play, he's almost broken the 150-target mark and is on pace to reach 180. No wonder he is the leading fantasy receiver in FP/G and the most valuable one.
- Thomas' catch rate (82.3%) is second only to Ryan Griffin (82.9%). The problem is that Griffin has been targeted 41 times at the tight end position compared to Thomas' 147 as the leading receiver of the Saints. Only two other players with 100-plus targets on the season are averaging catch rates at or over 70%: Amari Cooper (70% on 100 targets) and Chris Godwin (71.7% on 113). Thomas is insane.
- As is always the case with touchdowns, they are important to get some extra juice in the shape of fantasy points, but they aren't that important to have great players around. Look at Robert Woods. He's the WR18 on the season and has only one score to his name.
- None of D.J. Moore (4), Julio Jones (4), and Davante Adams (3) have reached five touchdowns, though all of them are averaging over 16 FP/G. At the other end, Darren Fells has scored 7 touchdowns yet he only is averaging 7.9 FP/G.
"Total" Yards (Air Yds + YAC) / "Air" Yards
Correlation with Fantasy Points: 88% / 82%
Leaders and Trailers:

Leaderboard Notes:
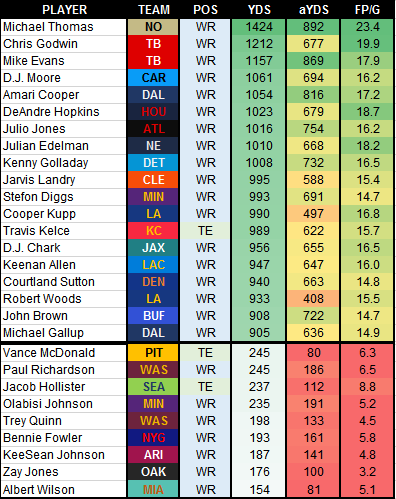
- Nothing surprising here, as receiving yardage is factored into the calculation of fantasy points without much hard math involved. Leaders in yardage average the most fantasy points, with the touchdowns and receptions just being a weekly bonus to their tallies.
- Even with a low average Air Yards value (7.7 per reception), Thomas leads the league in total yards gained through the air with 892. Mike Evans is second (869), followed by Cooper (816).
- That doesn't mean Thomas is not good after the catch. In fact, he's second (532)) in total YAC only behind Chris Godwin (535), with Woods (525) rounding out the top three.
- A total of 24 players have gained more yards after the catch than through the air. Of those 24, only eight are averaging more than 10 FP/G, and only seven are wide receivers compared to 17 tight ends.
- Dallas Goedert's 396 total yards have the highest YAC profile of the league, as only 116 of them are air yards and the other 280 (70.7%) came after the catch. He's the only player in the league with a 70%/30% YAC/aYDS split. Vance McDonald is second at 67%/33%.
- Calvin Ridley and Marvin Jones have the completely opposite profile. Ridley has gained 84% of his yards through the air and Jones 83%, and both of them are virtually averaging 15 FP/G.
Yards After Catch / Expected YAC / YAC Above Expectation
Correlation with Fantasy Points: 4% / negative-5% / 11%
Leaders and Trailers:

Leaderboard Notes:
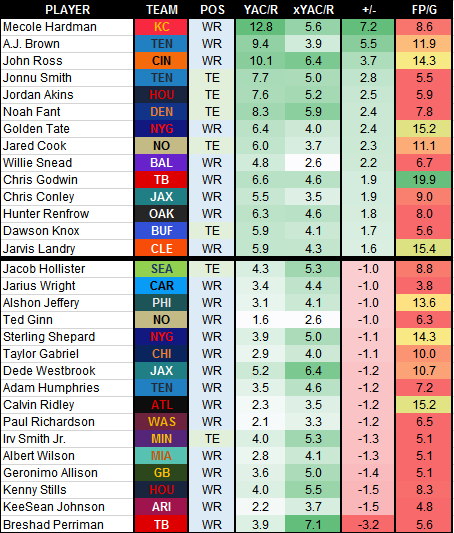
- Mecole Hardman and John Ross are getting closer and closer to finish the season with 10-plus YAC/R, the only two players currently doing it. The sample size isn't overly large, as both of them have missed time, but the feat is really incredible.
- A.J. Brown's case is a little more appealing, as he almost doubles the number of targets he has seen over the other two. His 9.4 YAC/R are virtually the same and he has clearly outperformed the expectations with 5.5 YAC/R on the season, good for a second place in the leaderboard.
- There are nine players with an xYAC/R mark at or above 6.0, and three are tight ends. T.J. Hockenson (0.3 +/-) might have fallen a little short of the other two, but Noah Fant (2.4 +/-) should be one to keep our eyes on as his career progresses as he has beaten no other than George Kittle (1.2 +/-) in his limited chances.
- Breshad Perriman's late explosion in the Tampa Bay offense has nothing to do with what he's done earlier in the season. He's got the lowest +/- by far (negative-3.2, with the second-lowest being at negative-1.5 by Kenny Stills) and has clearly underperformed his "after-the-catch chances", although his 296 yards on 19 receptions have been good for 15.6 per receptions and a couple of touchdowns.
- None of these three metrics is meaningful when evaluating players in the fantasy football context. Of players averaging 16-plus FP/G, five have negative +/-, nine have positive +/-, and another one sits at zero.
That's it for today. Until we meet again next week, I hope you can crush your waiver wire, set up the best possible lineup, and make it to the championship game after sailing through the semifinals!


 RADIO
RADIO


