 RADIO
RADIO


What is batted ball distribution? Definition and meaning of batted ball distribution as part of our sabermetrics glossary for fantasy baseball.
Welcome, RotoBallers, to our overview of batted ball distribution, or a batter's rates of grounders (GB%), flies (FB%), and line drives (LD%). This article is a deeper dive into batted ball distribution, and is part of our ongoing series "Using Sabermetrics for Fantasy Baseball."
In this article, we'll explain the differences between grounders, flies, and liners in terms anyone should understand. We'll begin with an examination of how fantastic liners are for hitters. We'll also look at why ground-ball profiles are good for batting average while fly balls are better for power hitters.
You can find our entire sabermetrics glossary, which includes links to many other sabermetric stats, as part of this series. Each stat deep dive will be released over the next few days. Stay tuned!
Be sure to check all of our fantasy baseball lineup tools and resources:- Fantasy baseball trade analyzer
- BvP matchups data (Batter vs. Pitcher)
- PvB matchups data (Pitcher vs. Batter)
- Who should I start? Fantasy baseball comparisons
- Daily MLB starting lineups
- Fantasy baseball closer depth charts
- Fantasy Baseball live scoreboard
- Fantasy baseball injury reports
What is Batted Ball Distribution? Sabermetrics Glossary
Fly balls can turn into home runs. Ground balls never do. It seems that fantasy baseball managers want their batters to hit nothing but flies, yet this is not always true.
Why would this be? The answer comes down to batted ball distribution. The league average batted ball distribution in 2024 was 19.6 percent line drives, 42.2 percent ground balls, and 38.1 percent fly balls. Most players vary from this standard breakdown, providing insight into their fantasy viability.
The best place to find a hitter's batted ball distribution is by searching them on FanGraphs and scrolling to the fifth chart, "Batted Ball." It's the same chart we used to look at HR/FB in our previous article. Now that you know where to find this information, let's look at how to interpret it.
The Value of Line Drives
Let's first look at how all major leaguers fared on each batted ball type in 2024. Grounders generated a BABIP of .245. Flies were not as productive, posting a .110 figure. This makes sense, as pop-ups seldom fall in, cans of corn to the outfield are only slightly better, and homers are considered out of play and do not count toward BABIP.
Line drives turned into base hits far more frequently, posting a .693 BABIP. The difference between liners and anything else is startling. Batters want line drives.
Josh Smith's 2024 campaign provides a good illustration of what a few extra liners can do. His triple slash line of .258/.337/.394 was easily a career best, and the biggest reason why was a BABIP that spiked to .311 from a .278 career mark. Smith's BABIP jumped because of a slight LD% increase to 23.7 percent from a career mark of 22 percent.
That's less than two percentage points, but remember how productive liners are. Two percentage points took Smith from replacement level to a key player in Texas's lineup with fantasy viability.
LD% generally isn't a predictive stat, meaning it fluctuates widely without indicating that a player has found a new level. Therefore, we shouldn't expect Smith to repeat his LD% and corresponding production in 2025. Don't want to believe it? Last year's example was Jarred Kelenic, someone you didn't want to roster in 2024.
This is not to suggest that no one consistently posts above-average LD% rates. For example, liners were a big reason Luis Arraez hit .314/.346/.392 and captured the NL batting title last season. His 26.5 percent LD% in 2024 crushed Smith's, but Arraez has six straight MLB seasons of above-average LD% rates on his resume:
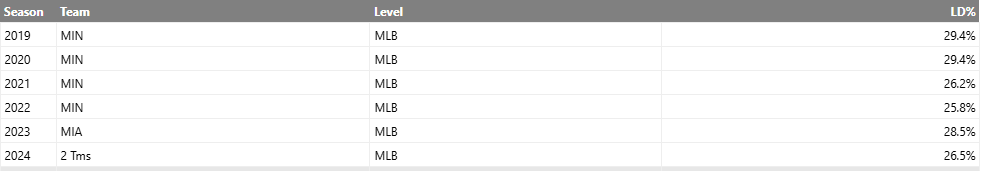
Arraez has a career .339 BABIP, driven largely by a career LD% of 27.2 percent. It would be foolish to suggest that Arraez is just lucky, considering his consistency. Therefore, we credit Arraez for being a plus-BABIP guy due to an LD% skill, just like we give Bobby Witt Jr. BABIP credit for his blinding speed.
This distinction has to be earned over numerous full seasons, however. Most LD% surges are more fluky Josh Smith than sustainable Luis Arraez.
Which Is Better: Ground Balls or Fly Balls?
Unlike LD%, both GB% and FB% are stickier -- a player's rates are likely to remain similar moving forward. By BABIP alone, grounders are better. However, this changes significantly if the slugging percentage is considered.
In 2024, grounders offered a slugging percentage of .269, only slightly higher than the .245 BABIP they posted. Flies had a .642 slugging percentage, easily offsetting the lower BABIP for most fantasy players.
The ideal batted ball mix, therefore, varies with the player. Elite speedsters want more grounders than flies as they don't have the oomph to hit many homers regardless. One-dimensional sluggers want fly balls, especially since shifts and a lack of speed often prevent them from realizing the larger BABIPs associated with grounders anyway.
Fantasy managers usually prefer players with power and speed potential to have a higher FB%, as the extra power is more beneficial than a few extra times on base. Incidentally, line drives averaged a ridiculous .900 slugging percentage to go with their .693 BABIP in 2024, so they are still the batted ball of choice.
Conclusion
To conclude, line drives are by far the most productive result for hitters. BABIP's luck-driven fluctuations are frequently driven by LD%, a largely random stat. GB% and FB% are more predictive, and which one is favored depends on the hitter. Grounders offer a higher BABIP, but almost zero power. Flies result in base hits less often, but generate much more power when they do.
The intricacies of BABIP could be a never-ending topic, but the information provided so far is generally enough for fantasy purposes. Stay tuned to learn about more metrics that can help you predict a player's future performance.


