Jon Anderson compares minor league hitting stats to Major League hitting stats to see which ones are predictive and which ones are not.
Of all the fantasy sports, baseball probably allows for the most amount of speculation. Given the nature of the game where players spend at least a couple of years in the minor leagues before getting to the highest level, there is a lot of analysis done on these minor leaguers with the hopes of figuring out what kind of Major League player they'll be.
Over the course of this season, I have done a lot of work to compile minor league stats from the last two seasons. I have even found a way to put all the available minor league Statcast data together to use for analysis such as this.
What I want to do today is look at players who have spent significant amounts of time at both levels (minors and Majors), and then do some data analysis to see which stats tend to stick around after promotion, and which ones do not. This will help us learn more about what minor league stats are most predictive, and therefore which ones we should pay the most attention to.
Be sure to check all of our fantasy baseball lineup tools and resources:- Fantasy baseball trade analyzer
- BvP matchups data (Batter vs. Pitcher)
- PvB matchups data (Pitcher vs. Batter)
- Who should I start? Fantasy baseball comparisons
- Daily MLB starting lineups
- Fantasy baseball closer depth charts
- Fantasy Baseball live scoreboard
- Fantasy baseball injury reports
Basic Stats
We can do a lot more with "basic" stats here since box score data is easy to come by. Between the 2021 and 2022 seasons, there are 158 different hitters that have seen at least 200 plate appearances in both the minors and the Majors. Note that I didn't break anything down by minor league level, I just clumped all those stats together for sampling purposes.
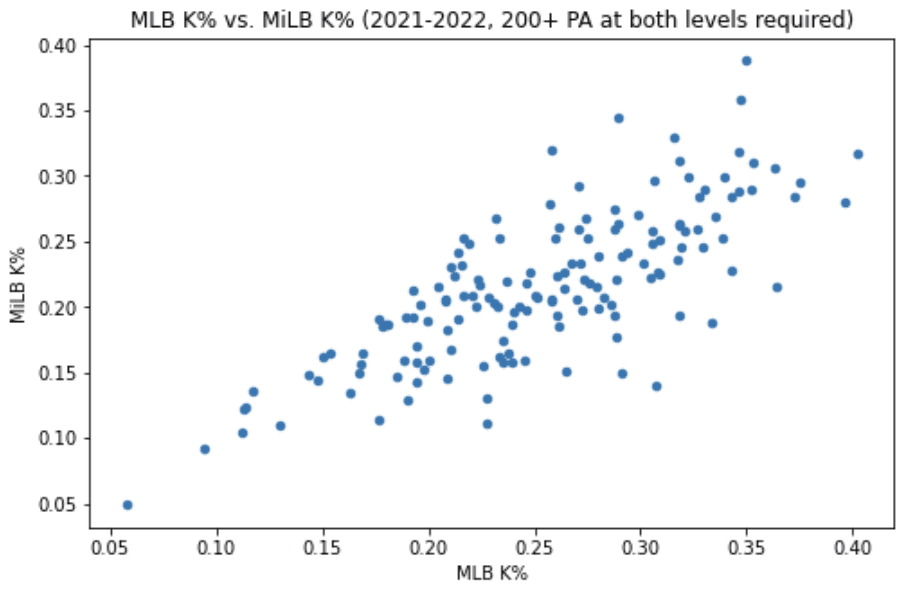
Let's walk through the main statistical categories and see what we learn! For each category, I will provide the correlation coefficient, which gives us a good idea of how predictive the minor league number is. If a coefficient is high (above .5, and the closer to 1 the better), that means there is a significant relationship between the two numbers, and we can definitely use the minor league number to predict the Major League number (so if a player has a 23% K% in the minors, we can feel pretty confident that he'll be within a couple of points of that mark in the Majors). I will also provide the average difference, which is just the average change in that stat from the minors to the Majors.
Strikeout Rate (K%)
Correlation Coefficient: 0.77
Average difference: +3.8%
The correlation coefficient denotes a significant positive relationship, although it's still not overly strong (typically looking for 0.9 or higher to denote a seriously strong relationship). You can see that the average change is nearly four points, which is a pretty big difference (going from a 22% K% to a 26% K% over a full MLB season would add more than 20 strikeouts to a hitter's total). However, it's fair to expect a hitter that was great in K% to at least be good in K% in the Majors.
80% of the sample got worse in K% after being promoted to the Majors. The biggest decline was Cal Raleigh, who had a 14% K% in the minors but then a huge 31% mark in the Majors (he is the dot closest to the bottom-right corner of the plot). That's certainly an exception here, as most of the time we saw drops between two and six points. The outlier on the other side of it was Jake Bauers, who brought his 32% minor league K% down to 26% in the Majors.
Walk Rate (BB%)
Correlation Coefficient: 0.695
Average difference: -2.3%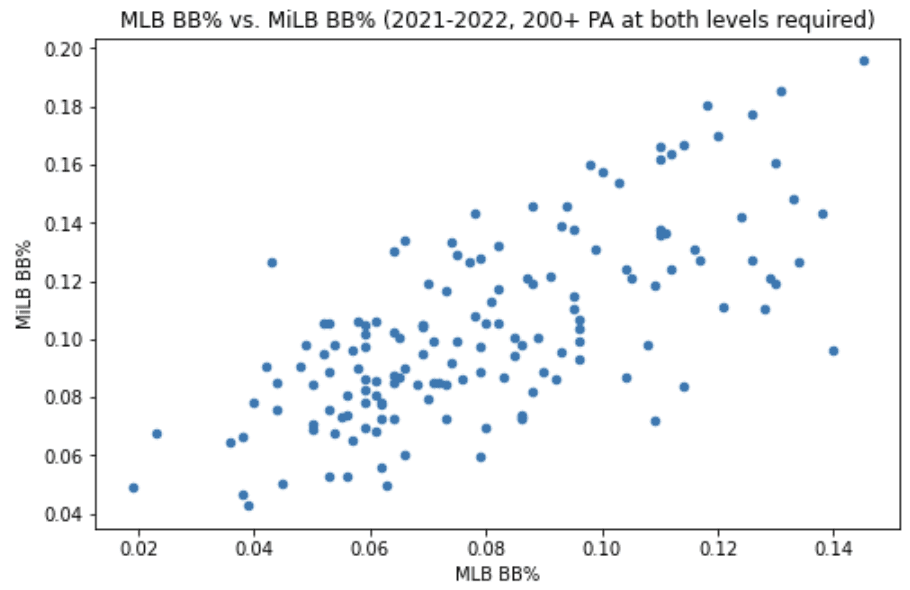
Pitchers simply throw more strikes in the Majors (throwing strikes is a good reason a guy gets promoted the whole way up the chain, as it turns out).
This explains that the average hitter sees his walk rate fall by more than two points after getting to the Majors. Surely there's more to it than just the pitchers throwing more strikes. Pitch quality is much better in the Majors, making it harder for a hitter to limit swings at pitches out of the zone, and other things like that.
Only 23 of the 158 (14.6%) hitters in the sample posted higher walk rates in the Majors than in the minors (three of them were Cardinals - Nolan Gorman, Brendan Donovan, and Paul DeJong). The biggest decline was Nelson Velasquez, who went from a 12.7% BB% in the minors to a 4.3% BB% in the Majors in a limited time. The biggest improver was Jackson Frazier, who went from 9.6% in the minors to 14% in the Majors.
Batting Average
Correlation Coefficient: 0.39
Average difference: -.023
A very weak correlation here. That's not surprising since year-over-year, Major League batting averages aren't strongly correlated, either. There is so much randomness in that statistic that we absolutely wouldn't expect it to translate consistently between the two levels. The scatter plot tells the tale, there's no semblance of a straight line anywhere.
I will spare myself some time, the same is true with things like on-base percentage and slugging percentage.
Stolen Base Attempts
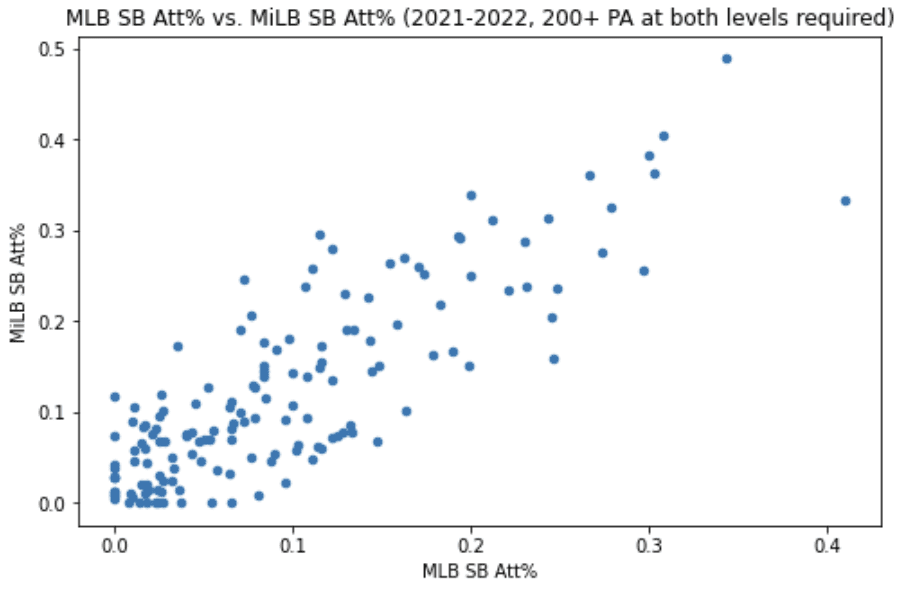
Correlation Coefficient: 0.837
Average difference: -.028
This is an uncommon stat, but one that I find useful. The formula is (SB + CS) / (1B + BB + HBP). With this, we're trying to get a rough idea of what percent of the time a hitter attempts a steal when they have the chance to. It's not perfect, but it tells enough of the story for us to use.
We see a strong relationship here as well as that coefficient jumps well above 0.80. Some of that is driven by the couple handful of guys that just don't run at all at either level, but even if we focus on the players with at least a 5% attempt rate in the minors, the coefficient stays strong at 0.797.
The average loss is 2.8%, which isn't much, so it's pretty fair to say that a high-attempts guy in the minors will be a high-attempts guy in the Majors, and vice versa. That doesn't mean that they'll be a high steals guy in the Majors, necessarily, because steal opportunity is tougher to come by in the Majors (it's tougher to get to first, especially with the significantly lower walk rates we already talked about).
Despite the negative average rate, the majority of hitters in the sample actually increased their rates in the Majors rather than seeing them decline. Pinch running probably has something to do with this (Bubba Thompson, for example - was used a ton last year off the bench in situations where they really needed to swipe a bag), and the overall "prove myself" mindset for a young player might factor in as well.
All of this will likely look different after this next MLB season since the rule changes about pick-off attempts are likely to make a big difference on how base runners approach steals (there will probably be vastly more attempts next year), but regardless, it's pretty safe to expect minor league base stealers to continue to be aggressive once they reach the Majors (provided they can get on base).
Statcast Data
In recent years, some minor league parks instituted the Statcast infrastructure to capture pitch and batted ball data as they do in the Majors. In 2023, all of AAA will have it - which will give us access to tons more data, which is very exciting.
For now, I'm pretty limited in what I can do, but it's enough to learn some small things.
I checked for hitters with at least 50 batted balls captured by Statcast in both the minors and Majors from 2021-2022, and I found 85. Full data can be found here.
Launch Velocity
Correlation Coefficient: 0.697
Average difference: -1.87 mph

So we see a definite relationship there, and not all that big of an average loss in exit velocity. This is an interesting stat because it really does heavily involve basic physical ability (how hard can you swing a heavy piece of wood). Swing speeds probably don't change between the minors and the Majors, why would they? The thing that does change is how difficult it is to hit the ball on the sweet spot of the bat. It's certainly tougher to do that against Major League pitching, which I'm guessing explains almost all of this average drop in exit velocity.
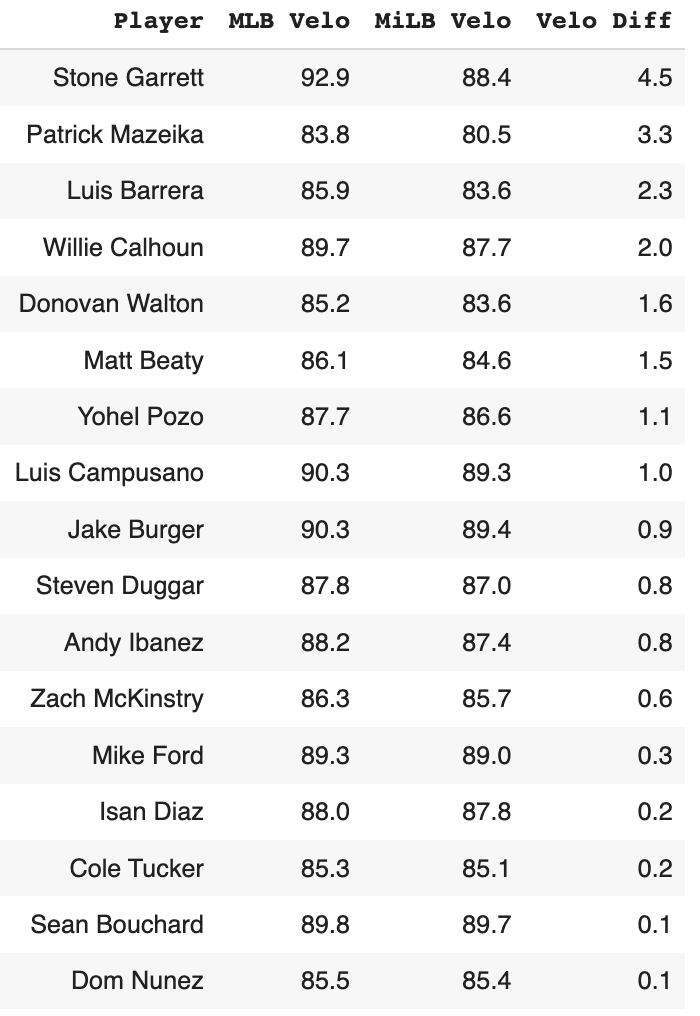
80% of the sample lost exit velocity, leaving just 17 players that improved, and here they are:
It really doesn't make a ton of sense that a hitter would immediately improve in exit velocity after reaching the Majors. It could happen if an offseason separates the sample since that would have given them time to bulk up in the winter, but hitting the ball harder in the Majors in the same season is probably just a result of good luck (I'm looking at you, Stone Garrett!). Pitching is much, much better in the Majors - so a hitter must improve to keep the same or better quality of contact after reaching the next level, and you just aren't going to do that overnight.
But anyways, the point is that there is a relationship here. The minor league exit velocity king in the minors in this sample was Sam Hilliard with an average velo of 94 miles per hour down there. In his limited time in the Majors, he's posted a strong 90.6 mph average exit velocity. If you're swinging the bat very fast in the minors, you're going to do that in the Majors too - so contact will continue to be loud when you make it (with Hilliard, that's the problem - actually making contact!).
Launch Angle
Correlation Coefficient: 0.697
Average difference: -.78 degrees
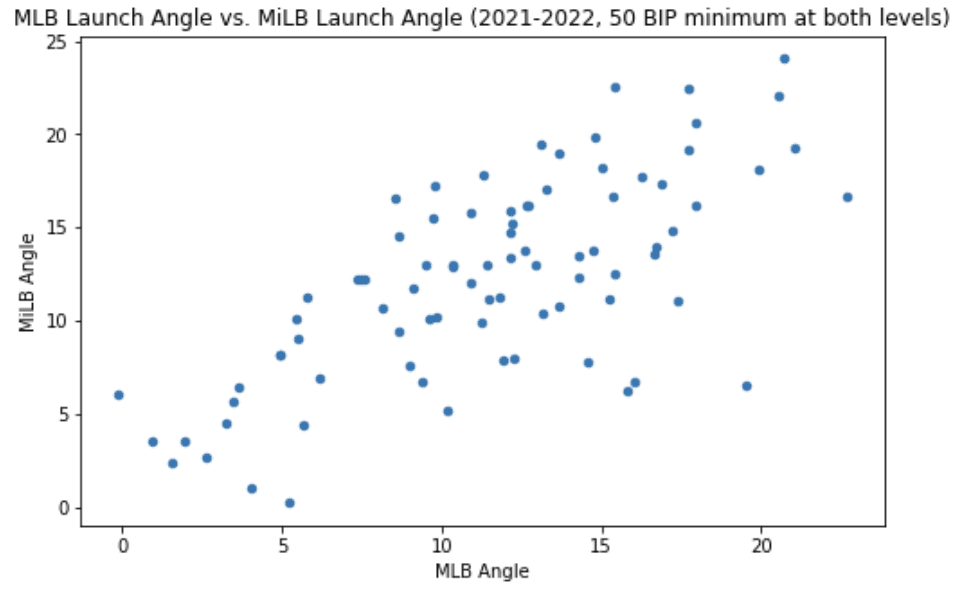
The plot above looks a bit scattered, but we do see a pretty good relationship here. Almost all of the hitters saw their MLB angle range fall within two degrees of their minor league angle range, which gives some credence to the idea that this is really all about swing path - and swing path doesn't change much between the minors and the Majors.
64% of the sample saw their launch angle come down after getting to the Majors, so you are more likely to see the change go in the downward direction. That makes some sense since plenty of Major League pitchers have the specific goal in mind of keeping the ball out of the air where all the serious damage happens.
If you're in that sweet spot in the minor leagues (between 15 and 30, per say), most of the time you're staying in that range in the Majors as well. But again, there's a whole other challenge involved here - actually putting the ball in play. It's harder to put the ball in play in the Majors, and we've seen that it's a bit harder to hit it with the same velocity as well - but when the ball is put in play, the launch angle distribution typically stays pretty much the same between the different levels of play.
Contact Rate
Correlation Coefficient: 0.66
Average difference: -3%
I limited this to hitters who had 50 swings in both samples, which isn't a ton of guys (56 players). You can see a moderate relationship here, and a pretty significant drop of three points. You just aren't going to find a guy with a 70% contact rate that comes up to the Majors and then puts up an 80% mark, but you just might see that happen in the inverse. But a general rule is that you should expect an 80%+ contact rate guy in the minors to come up and be at least league average-ish in the Majors.
Conclusion
A lot of different things can happen when a player comes up from the minors, but the data leads me to this mindset:
- The strikeout rate is pretty consistent, it's very unlikely to see a guy's K% climb by 5+ points. The expectation should be 2-3 points higher as he first enters the Majors.
- Expect fewer walks across the board in the Majors. A low-walk minor league hitter will remain a low-walk player in the Majors, but a high-walk hitter in the minors probably won't become a low-walk guy in the Majors.
- Don't even look at batting average, on-base percentage, or slugging percentage.
- Players that attempt steals at a high rate in the minors will do so in the Majors; in fact, they more often attempt steals at an even higher rate. However, that doesn't necessarily lead to more steals because it's much tougher to reach base (and get playing time) in the Majors.
- The players hitting the ball very hard in the minors will hit the ball hard in the Majors, and the players hitting the ball softly in the minors will hit the ball softly in the Majors. You can expect a drop off of 1-3 points in exit velocity in the Majors, but it's not a huge difference. The key point here is that you should expect more whiffs in the Majors, which results in fewer balls in play.
- The launch angle is pretty sticky. The average hitter drops his angle by a couple of degrees after going to the Majors, but fly-ball hitters will remain fly-ball hitters and ground-ball hitters will remain ground-ball hitters, at least over the short term.
Hope this helps! We will have a lot more coverage of minor league Statcast data during the 2023 season as the International League makes that available to us. I'll probably even be writing a weekly wrap-up post here covering everything interesting happening in that data. Keep it locked on RotoBaller!
Download Our Free News & Alerts Mobile App
Like what you see? Download our updated fantasy baseball app for iPhone and Android with 24x7 player news, injury alerts, sleepers, prospects & more. All free!

More Fantasy Baseball Advice
 RADIO
RADIO


