


 RADIO
RADIO


In Part 6 of his fantasy baseball strategy series to make sabermetrics accessible to fantasy owners, Rick Lucks breaks down how to use Pull% to project and validate a hitter's power.
Earlier in this series, we saw that fantasy owners generally prefer batters to hit the ball into the air in order to have a chance at a home run. Yet, all fly balls are not equal for this purpose. A player can maximize his power production by pulling the ball in the air.
One way to illustrate this is to look at league-wide HR/FB by batted ball direction. Flies to the opposite field seldom found the cheap seats, posting a HR/FB of just 3.8%. Flies to dead center fared slightly better (8.1% HR/FB), but pulled fly balls were clearly the most productive (34.6% HR/FB).
Let's take a closer look at how Pull% can help you win your fantasy leagues in 2019!
Be sure to check all of our fantasy baseball lineup tools and resources:- Fantasy baseball trade analyzer
- BvP matchups data (Batter vs. Pitcher)
- PvB matchups data (Pitcher vs. Batter)
- Who should I start? Fantasy baseball comparisons
- Daily MLB starting lineups
- Fantasy baseball closer depth charts
- Fantasy Baseball live scoreboard
- Fantasy baseball injury reports
How to Interpret Pull%
In 2018, roughly 64% of all home runs were to the batter's pull side. Only 12% of homers went to the opposite field, with the remaining 24% going out to center. This distribution is fairly consistent year-to-year, so it's safe to count on going forward.
In a way, this makes intuitive sense. Pulled baseballs tend to be hit with the highest exit velocity, making it easier for them to leave the stadium. The power alleys next to the foul poles on either side of the ballpark also present the shortest distance to the cheap seats. If a player's HR/FB dramatically improves, a change in approach involving more pulled baseballs could help explain why.
Boston's Xander Bogaerts provides a good illustration of this kind of change. In 2015, he pulled only 16.7% of his fly balls, producing a HR/FB of 5.3% and a total of seven dingers. He significantly upped his power game in 2016 by pulling 28.1% of his flies, leading to a much higher 11.4% HR/FB and 21 bombs on the campaign. The increased power was not exclusively the result of the Pull% spike, as he upped his FB% as well (25.8% in 2015, 34.9% in 2016). It helped to validate his HR/FB increase, though.
His change in approach did not last. Bogaerts pulled only 24.5% of his flies in 2017, dropping his HR/FB to 7.2% and his season HR total to 10 in the process. Once again, the raw number of fly balls Bogaerts hit decreased (30.5% FB%), so the change in Pull% was not solely responsible for the loss of power. This example illustrates that while a change in Pull% can support an increased HR/FB, it will last only as long as the player wants it to.
It is also possible for a player to improve his HR/FB without an uptick in fly ball Pull%. Last season, Bogaerts clubbed a career-best 23 HR on the back of a FB% spike (35.6% FB%) and a 15.5% HR/FB. However, his Pull% on fly balls decreased to 23.7% last season. We can't use Pull% to validate Bogaerts's 2018 power spike, so we would need to look to other metrics to legitimize it.
You should also avoid looking at raw Pull%. Of all pulled baseballs in 2018, 58.7% were grounders. Pulled grounders might have a higher average exit velocity than other ground balls, but the shift still eats them up with minimal difficulty. They will never turn into home runs. In contrast, only 20.6% of pulled baseballs were classified as fly balls last season. Ideally, fantasy owners want their hitters to pull fly balls while limiting how often they roll grounders to their pull side.
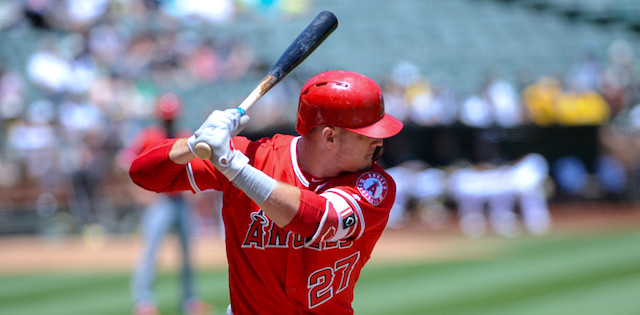
This is much easier said than done, as all players pull many more grounders than flies. Let's consider Mike Trout as an example. His raw Pull% of 40.2% was marginally lower than the league average 40.3%, and he pulled 56.4% of his grounders compared to 23.9% of his flies. At first glance, you might think that Trout was making himself vulnerable to the shift without significantly boosting his power potential.
That assumption would be wrong. The shift was designed for batters who pull much more than 56.4% of their ground balls, allowing Trout to hit a solid .304 against it last year. Many batters fail to pull even 20 percent of their flies, so Trout rated well enough in that regard as well. Trout is among the most well-rounded players in the game today, but he still pulled 21 of his 39 long balls last season. Pulling more grounders than flies is far from a death sentence.
Conclusion
To sum up, pulled fly balls tend to perform better than other fly balls. This means that pulling more flies can produce an increased HR/FB, but you should never use raw Pull% to determine this. Most pulled balls are hit on the ground, where all of the exit velocity in the world cannot turn them into home runs. Therefore, you should filter a player's Pull% by batted ball type to produce the most reliable results. The next part of this series will look at lineup slot as a predictor of counting stats such as RBI and runs scored.