Antonio Losada provides fantasy football updates from Week 1 for wide receivers and tight ends, using NextGen data to help fantasy owners make the best lineup and waiver wire decisions for the 2020 NFL season.
We made it! We wagered through a long and tedious preseason but real football hit us in the forehead for the first time this season during the past few days and change. But just as soon as it came, it went. The first week of the season is over and we have some tasty numbers already available and ready to be crunched.
To gain the biggest edge in your fantasy football league, it's necessary to understand how to apply the advanced statistics being used in sports nowadays. Back in the day, it was all about wins and losses, passing yards, and touchdowns scored. It's not that those stats are now worthless, they just don't offer enough information to savvy analysts. While football is still in its infancy compared to baseball in terms of analytics, the evolution the sport has seen lately in those terms is notable.
Each week, I'll be tackling NFL's Next Gen Stats, bringing you data from the previous week's games with notable takeaways you should consider when assessing fantasy players for the upcoming week. In case you're new to the series, or Next Gen Stats altogether, I recommend you read our NGS-primer. Now, let's get to the data!
Be sure to check all of our fantasy football rankings for 2025:- 2025 fantasy football rankings (redraft)
- Dynasty fantasy football rankings
- 2025 NFL rookie fantasy football rankings
- Best ball fantasy football rankings
- Quarterback fantasy football rankings
- Running back fantasy football rankings
- Wide receiver fantasy football rankings
- Tight end fantasy football rankings
Week 1 - TE/WR Air Yards Don't Lie - NextGenStats
If you remember the introductory post to the series, you already know Air Yards tells us the vertical yards on a pass attempt from the line of scrimmage to the point where the ball was caught by the receiver (or the catch failed to be completed.) I will be using mainly two metrics here: Average Targeted Air Yards (TAY), and %Share of Team's Air Yards (TAY%). TAY tells us how many air yards a receiver is thrown per target. TAY% measures the percentage of Air Yards a receiver was thrown at over the sum of his team's total Air Yards.
As we have only seen one week of action, it would be a little hasty to make too many conclusions out of just one game worth of data. That is why I'm leaning toward receivers (wideouts and tight ends) for the first entry of the series. This doesn't mean Air Yard values are already stabilized, not close to it, but it is highly probable that what we see in Week 1 stays the same at least in the short-term future.
Today, I'll present each of the stats from the NFL's advanced metrics site, its correlation with receiver fantasy points, and a list of leaders and trailers in each category along with some notes and takeaways on both the players' and the metrics' impact on fantasy football as a whole.
So let's dive in. Note: The cutoff is set at 5 targets for both WR and TE.
Cushion / Separation
Correlation with Fantasy Points (based on the 2019 season): negative-15% / negative-24%
Leaders and Trailers:
Leaderboard Notes:
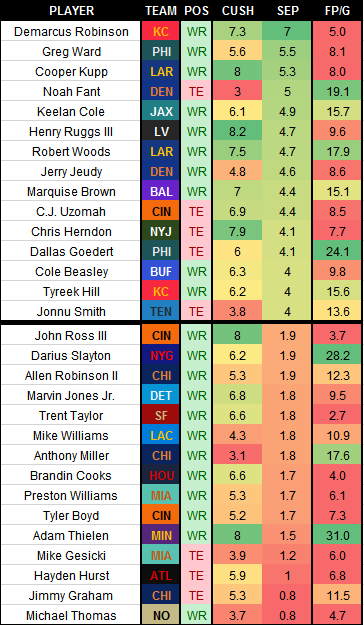
- I have sorted the leaderboard by SEP just because it has a little higher relationship with fantasy points. As you can see, a third of the players with high SEP values are tight ends. That comes down to them not being covered as tightly as other, more skillful receivers. Also, tight ends are often used as security blankets, so they're thrown passes only when they're quite open.
- That's not the only reason, though, as most tight ends also find it hard to really separate from defenders because of their frames and how their bodies are built. Let's say they're not speedsters.
- Even giving him one of the largest CUSH (separation between the receiver and the defender prior to the snap), Demarcus Robinson (7.0) lapped the field in terms of SEP (separation between the receiver and the closest defender at catch-point) with a 1.5-yard difference between him and no. 2 Greg Ward (5.5). Robinson is a burner and ankle-breaker, and he proved so in his 6 targets from W1. That difference between Robinson and the second-highest SEPwas the same as the one between Ward and no. 13 Cole Beasley (4.0).
- Although Robert Woods and Jerry Jeudy posted lower SEP values, the truth is that both of them did so on 8 targets, which made their values more "stable" even on a still small sample.
- Up to nine players averaged at least an 8-yard CUSH, with Curtis Samuel (8 targets) and Amari Cooper (14) leading the pack. Cooper made the most of those early-separation gifts, catching 71.4% of his passes even while getting closed at the point of the catch to just 2.4 SEP yards.
- Darren Waller (8.1) was the only tight end to average an 8+ CUSH, virtually the same as teammate WR Henry Ruggs III (8.2). The next TE in the list was Chris Herndon (7.9), and no other player at the position reached even a 7-yard CUSH.
- Every WR/TE to score 20+ PPR points in Week 1 averaged a SEP under 4 yards except Dallas Goedert (4.1). But to prove the low relationship between SEP and fantasy points, it also was true that the seven-lowest scorers (under 5 PPR-points) all had SEP values under 3.4 yards...
- The same happened with CUSH and scoring. Of those averaging at least 8 yards of cushion, only Cooper and Thielen reached 18+ PPR points... but the same happened at the opposite end of the board: only Anthony Miller and Noah Fant scored 17+ PPR points while having CUSH marks under 4.2 yards.
- In a few words: don't rely on CUSH or SEP. Those are a couple of descriptive, not predictive stats.
Correlation with Fantasy Points (based on the 2019 season): 20% / 71%
Leaders and Trailers:
Leaderboard Notes:
- Opportunity trumps everything in fantasy football, and it can be seen in the highly related link between the percentage of yards a team/QB throws toward a player and the fantasy point he scores.
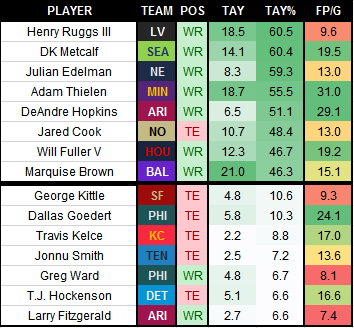
- This is made clear by the table above, which I have sorted by Targeted Air Yards% (among teammates). Virtually every player (except Henry Ruggs) shown at the top of the table (and in fact, every player with a TAY% higher than 41%) reached double-digit fantasy points in W1.
- It is rather impressive to find Jared Cook in the table above. His 48.4 TAY% was not only the highest among Saints, but he also was the only tight end to rank inside the top-34 players in that stat (TE Logan Thomas was the 35th WR/TE in TAY%). That doesn't mean his actual TAY were super high, coming in at just 10.7 (third-lowest among WR/TEs with a 43%+ TAY%).
- Being targeted is nice. Being targeted for huge yardage is better, but it is also riskier as those booming plays have a lower chance to end in completions/scores often. That's why DeSean Jackson (obviously...) led W1 in TAY (29.1) but only finished with two receptions in seven targets for 6.6 PPR. Something similar happened to Ruggs, who couldn't break the 10-PPR barrier.
- On the positive side of things, Marquise Brown kept being a deep-threat with his 21.0 TAY for 15.1 PPR points, while Marquez VS also posted 20+ TAY and finished in the double-digits scoring 19.6 fantasy points.
- Watch out for Mark Andrews' season in Baltimore. The talk about tight ends always come down to Ertz/Kelce/Kittle, but Andrews was targeted the furthest downfield of any TE (13.0 TAY), caught five of six targets, and finished W1 as the TE2 only behind Dallas Goedert.
- Some team/player/air-yard/usage notes: Henry Ruggs had the biggest difference in TAY% with the second most-used player of his team (Darren Waller), so he will improve his fantasy scores down the road.
- Julian Edelman finished second in that regard, with a clear WR1 role in New England. Darius Slayton closed the top-3 in Week 1 with 44.4% of the Giants air yards going his way.
- On the other side of the spectrum, the no. 1/2 receiving-pairs to finish the closest in TAY% were John Brown and Stefon Diggs, T.Y. Hilton and Parris Campbell, Sammy Watkins and Tyreek Hill, Diontae Johnson and JuJu Smith-Schuster, O.J. Howard and Chris Godwin, and Logan Thomas and Terry McLaurin.
Receptions / Targets / Catch% / Touchdowns
Correlation with Fantasy Points (based on the 2019 season): 86% / 85% / 22% / 73%
Leaders and Trailers:
Leaderboard Notes:
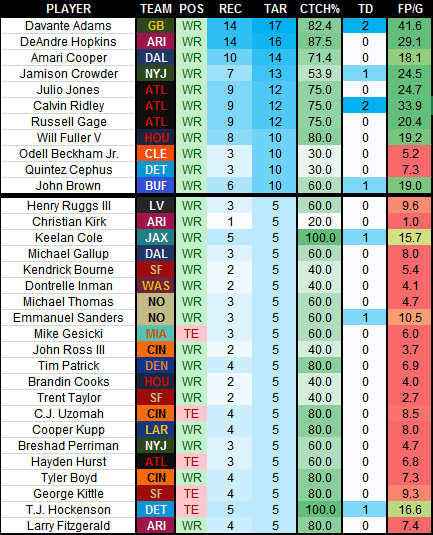
- Obviously, receptions trump targets in terms of fantasy-point production (in PPR formats, that is) because well, they hand out actual fantasy points. That's why 25 of 27 (92.6%) players with 6+ receptions reached double-digit PPR points in W1.
- That being said, though, nine of 11 (81.8%) players with 10+ targets reached 10+ PPR points, and 26 of 36 (72.2%) players with 8+ targets did so too.
- Don't overthink it: chase targets when drafting/trading for/acquiring players through waivers.
- No tight end was targeted 10 times in Week 1, with Dallas Goedert logging nine targets from Carson Wentz and leading in that front. Waller, Hunter Henry, and Logan Thomas had eight targets each... and as you could expect all of them finished with 10+ PPR points.
- Shouts out to Hopkins and Adams, both with 14 receptions. All of their numbers were pretty close, but Adams clearly mattered the most for his fantasy GMs as he scored a couple of TDs to Hopkins' none, boosting his fantasy point tally up to 41.6 (!) PPR points.
- Hopkins was, though, the only player targeted 10+ times to post a catch rate of over 83%. He was automatic in Week 1 playing for his new team in the Cardinals. The numbers will regress, obviously, but Hopkins and Arizona can't probably be happier with their partnership. Adams and Will Fuller V were the only other two players with catch rates of 80%+ while targeted 10+ times.
"Total" Yards (Air Yds + YAC) / "Air" Yards
Correlation with Fantasy Points (based on the 2019 season): 90% / 84%
Leaders and Trailers:
Leaderboard Notes:
- Nothing surprising here, as receiving yardage is factored into the calculation of fantasy points without much hard math involved. Leaders in yardage average the most fantasy points, with the touchdowns and receptions just being a weekly bonus to their tallies (ask Davante Adams...)
- Julio hasn't lost a step, Adams is the only viable option in Green Bay's attack, and pretty much the same goes for Hopkins in Arizona. Calvin Ridley and Russell Gage finishing with 114+ yards each, though? That was absolute incredible for Atlanta to pull off, as it is not often seen three WRs reaching those marks.
- Perhaps most interestingly, none of those three Falcons got more than 43% of their yards after the catch. That means that QB Matt Ryan was spot-on and deadly accurate on his throws, not having to rely on extra efforts from his receivers.
- Two players finished W1 with all of their yards coming after the catch: TE Jonnu Smith (36 yards) and WR Demarcus Robinson (20). Only three more players reached their yards with 80%+ of them after the catch (Robert Woods, Brandin Cooks, and Jamison Crowder.
- At the other end of the spectrum, both TE Mike Gesicki and WR Trent Taylor logged no yards after the catch at all, yet they only got 30 and seven yards respectively. Adam Thielen was much more impressive here, with 110 yards of which 108 went to him through the air and only two (1.8%) he added after the catch.
Yards After Catch / Expected YAC / YAC Above Expectation
Correlation with Fantasy Points (based on the 2019 season): 6% / negative-5% / 11%
Leaders and Trailers:
Leaderboard Notes:
- Don't get too lost in this data with just one week of games in the books. Things will take a little bit of time to stabilize as more reps are factored into the stat lines.
- Jamison Crowder is a great example of this effect. His reception for a touchdown last Sunday absolutely skewed his +/- as he dodged the defense and added a ton of yards after catch in a single play, boosting his overperformance to almost twice the levels of second-ranked Robby Anderson (who himself had another ridiculously long-YAC scoring play).
- No players finished last season with more than 8.8 YAC/R, while six of them reached that mark in Week 1. Again, don't bet on that staying there, even less with two tight ends among those in the six-player group.
- The same goes for the expected YAC/R. Only Deebo Samuel (7.5) topped the 6.2 mark, while up to 14 (!) players did so this past weekend. That's insane and not realistic at all. Expect some regression to the mean soon.
- Even though Brandin Cooks posted the fourth-highest +/-, his fantasy production was putrid (4.0 PPR points). Normal, considering he only had a couple of receptions on five targets for just 20 yards and no scores. Similar case to that of Demarcus Robinson and his 1.7 +/- for just 5.0 PPR points on a 6/3/56/0 game.
- On the other end, get excited about Stefon Diggs and (perhaps) Logan Thomas. They had the second- and third-lowest +/- marks of the weekend at -3.7 yet both scored 13+ PPR points, clearly exceeding the expectations even though they could add a lot of yardage after the catch. Same for Corey Davis and Will Fuller V.
That's it for today. Until we meet again next week, I hope you can crush your waiver wire, set up the best possible lineup, and get ready for another weekend full of fireworks!
Download Our Free News & Alerts Mobile App
Like what you see? Download our updated fantasy football app for iPhone and Android with 24x7 player news, injury alerts, rankings, starts/sits & more. All free!

More Fantasy Football Analysis
 RADIO
RADIO


