Nicklaus Gaut continues his look at the differences between SIERA and ERA for top starting pitchers by looking at three SP being drafted around the top-100 who could be fantasy baseball fallers in 2020.
Welcome back RotoBallers to my Lie Detector mini-series (you can read part one here). Skills-Interactive ERA (or SIERA) has been around since 2011 when it was introduced at Baseball Prospectus by Matt Swartz and Eric Seidman before moving to its current home at Fangraphs. Much like xFIP, SIERA attempts to quantify the skills that underpin a pitcher's ERA, albeit in a different manner. Although technically a backward-looking evaluator, SIERA is slightly more predictive than xFIP in terms of the following year's ERA and most gets at the how and why of a pitcher's success.
FIP and xFIP generally ignore balls in play, focusing on only the things that pitchers can directly control; strikeouts, walks/HBP, and home runs. SIERA tries to take into account how specific skills (strikeouts, walks, ground balls) interact with each other in order to help pitchers limit runs. Strikeouts are even more valuable in SIERA, as high-K pitchers induce more weak contact, thereby running lower BABIPs and HR/FB%. Walks are bad but not as bad if you don't allow many of them, as they have a lesser chance to hurt you. The more groundballs you allow, the easier they are to field and the more double-play opportunities you'll have.
Essentially, instead of giving "flat-rates" for different skills, SIERA weights them, moving up the skills of pitchers who have high strikeout- or groundball-rates, or low walk-rates. While SIERA is not the final word in ERA evaluators (as different evaluators have strengths in different areas), it is quite sticky in terms of the following year's ERA. Last time, we honed in on three popular pitchers who overachieved according to SIERA, and today we'll look at three more.
Be sure to check all of our fantasy baseball lineup tools and resources:- Fantasy baseball trade analyzer
- BvP matchups data (Batter vs. Pitcher)
- PvB matchups data (Pitcher vs. Batter)
- Who should I start? Fantasy baseball comparisons
- Daily MLB starting lineups
- Fantasy baseball closer depth charts
- Fantasy Baseball live scoreboard
- Fantasy baseball injury reports
Largest ERA Overachievers in 2019
Looking at starters in the top-300 of ADP in NFBC leagues, we'll start with the 25 biggest differences between their ERA and SIERA last season. For sake of consistency, I'll be using dollar values derived via the Fangraphs auction calculator for 5x5 standard 12-team leagues.
| Player | ADP | ERA | SIERA | DIFF | K% | BB% | GB% |
| Jacob deGrom | 7 | 2.43 | 3.29 | -0.86 | 31.7% | 5.5% | 44.4% |
| Jack Flaherty | 22 | 2.75 | 3.68 | -0.93 | 29.9% | 7.1% | 39.5% |
| Mike Clevinger | 29 | 2.71 | 3.31 | -0.60 | 33.9% | 7.4% | 40.8% |
| Clayton Kershaw | 41 | 3.05 | 3.77 | -0.72 | 26.8% | 5.8% | 48.0% |
| Luis Castillo | 42 | 3.40 | 3.95 | -0.55 | 28.9% | 10.1% | 55.2% |
| Patrick Corbin | 46 | 3.25 | 3.88 | -0.63 | 28.5% | 8.4% | 49.5% |
| Chris Paddack | 53 | 3.33 | 3.83 | -0.50 | 26.9% | 5.5% | 40.2% |
| Zack Greinke | 63 | 2.93 | 3.96 | -1.03 | 23.1% | 3.7% | 45.2% |
| Tyler Glasnow | 65 | 1.78 | 3.18 | -1.40 | 33.0% | 6.1% | 50.4% |
| Jose Berrios | 78 | 3.68 | 4.28 | -0.60 | 23.2% | 6.1% | 42.1% |
| Sonny Gray | 99 | 2.87 | 3.97 | -1.10 | 29.0% | 9.6% | 50.8% |
| Frankie Montas | 101 | 2.63 | 3.76 | -1.13 | 26.1% | 5.8% | 49.4% |
| Mike Soroka | 106 | 2.68 | 4.28 | -1.60 | 20.3% | 5.9% | 51.2% |
| Zac Gallen | 124 | 2.81 | 4.24 | -1.43 | 28.7% | 10.8% | 38.9% |
| Eduardo Rodriguez | 133 | 3.81 | 4.31 | -0.50 | 24.8% | 8.7% | 48.5% |
| Hyun-Jin Ryu | 144 | 2.32 | 3.77 | -1.45 | 22.5% | 3.3% | 50.4% |
| Kyle Hendricks | 156 | 3.46 | 4.38 | -0.92 | 20.6% | 4.4% | 41.3% |
| Mike Minor | 173 | 3.59 | 4.51 | -0.92 | 23.2% | 7.9% | 40.0% |
| Jake Odorizzi | 181 | 3.51 | 4.14 | -0.63 | 27.1% | 8.1% | 35.0% |
| Luke Weaver | 197 | 2.94 | 3.84 | -0.90 | 26.5% | 5.4% | 40.7% |
| Marcus Stroman | 204 | 3.22 | 4.41 | -1.19 | 20.5% | 7.5% | 53.7% |
| Aaron Civale | 250 | 2.34 | 4.74 | -2.40 | 20.3% | 7.1% | 40.5% |
| Sandy Alcantara | 262 | 3.88 | 5.28 | -1.40 | 18.0% | 9.7% | 44.6% |
| Dallas Keuchel | 272 | 3.75 | 4.39 | -0.64 | 18.7% | 8.0% | 60.1% |
| Yonny Chirinos | 279 | 3.54 | 4.25 | -0.71 | 21.5% | 5.3% | 43.3% |
Hakuna Matata
It means no worries. There are a few pitchers above whose ERA/SIERA differences don't exactly make me break into a cold sweat. Either their SIERA is possibly deceptive or they have other skills that should help mitigate the difference, allow them to continue to outpitch their peripherals. Or, they are the two-time, defending National League Cy Young award winner.
Please keep in mind that inclusion on the list above doesn't necessarily mean that the pitcher is due for a "bad year". SIERA is just one piece of the puzzle when evaluating a player's ERA, and ERA is only one piece of a pitcher's fantasy profile. Just because Jacob deGrom consistently outperforms his peripherals doesn't mean that he's getting "lucky". It means he's really good and can't be evaluated on one metric alone. This is all about bringing context to the results that a pitcher had in the past and what assumptions you're really making about their expected future performance.
Uh-oh, my alarm is going off. We now interrupt this regularly scheduled programming for the latest episode of Jack Flaherty Hype-Train.
Jack Flaherty, St. Louis Cardinals
2019: 2.75 ERA, 3.68 SIERA (0.93 run differential)
Flaherty may not put up the eye-popping numbers that he did in the second half of 2019 when he posted a 0.91 ERA and 0.76 WHIP, but who can you really expect to put that sort of otherworldly nonsense? Don't make the mistake of thinking that Flaherty is a story of one good half; he's been breaking out for a while, even with the 4.64 ERA that he put up in the first half of 2019. His first-half 4.16 SIERA and 4.11 xFIP speaks to it being a little better than meets the eye.
It's easy to look at Flaherty's ridiculous ratios and say he's due to take a step back since those numbers aren't sustainable. However, it's the underlying skills that make for a real breakout, and Flaherty has them in spades.
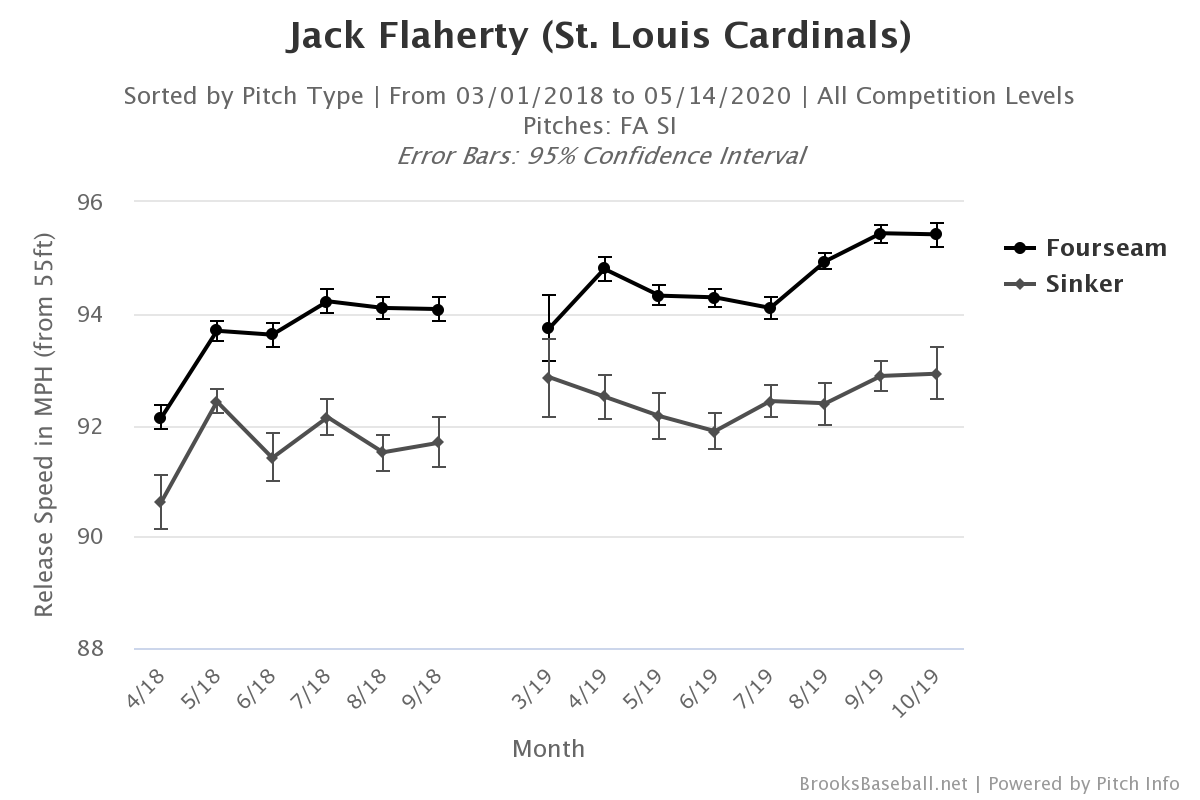
Velocity Increase
A steady uptick in velocity is always something to keep an eye one and Flaherty's has been rising since 2018.
Increased K% + Decreased BB%
Breaking it down by year, it appears that Flaherty has had the same near-30% K-rate and has shaved a few points off his walk-rate. Break it down by halves and it seems to be more of a progression by a young pitcher, with the second half of 2019 being the zenith. His 31.1% K-rate in the second-half of 2018 was a three-point increase from the first half but his walk-rate also jumped almost four-points to 11.4%.
The first half of 2019 was similar to the first half of 2018, with Flaherty back down to a 26.4% K% but had dropped back to a 7.9% BB%. He again saw another big strikeout jump in the second-half (33.9% K%) but this time it didn't come at the expense of his walk-rate, with Flaherty posting a 6.3% BB%.
Better Stuff + Pitch Mix Change
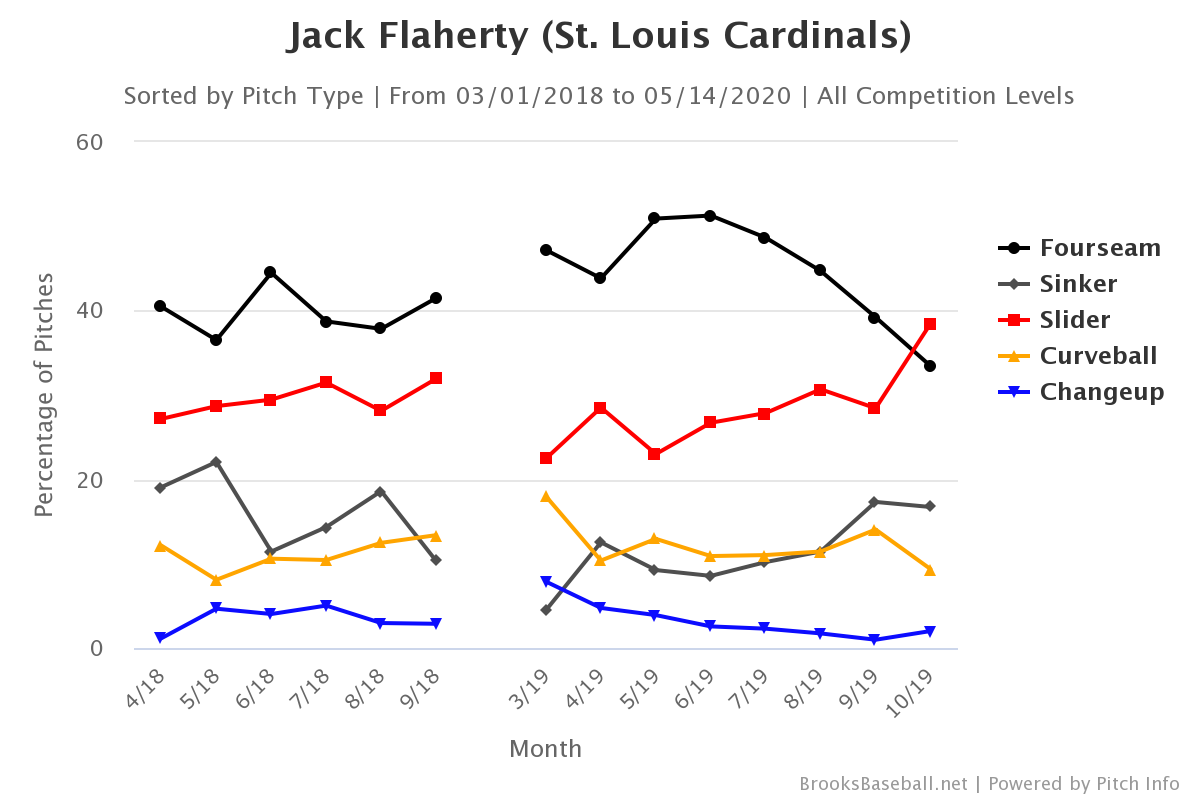
Flaherty mainly relies on a two- and four-seam fastball, curveball, and slider, along with a lightly used changeup. The slider is of the wipeout variety, with a 23.3% SwStr% (fifth-highest among starting pitchers), a 40.6% K% (12th-highest), an 82.1 mph average exit velocity (3rd-lowest), and a 2.6% solid-contact rate (6th-lowest). Translation? Batters can't really hit it and when they do, it's not very well. How has his pitch-mix evolved?
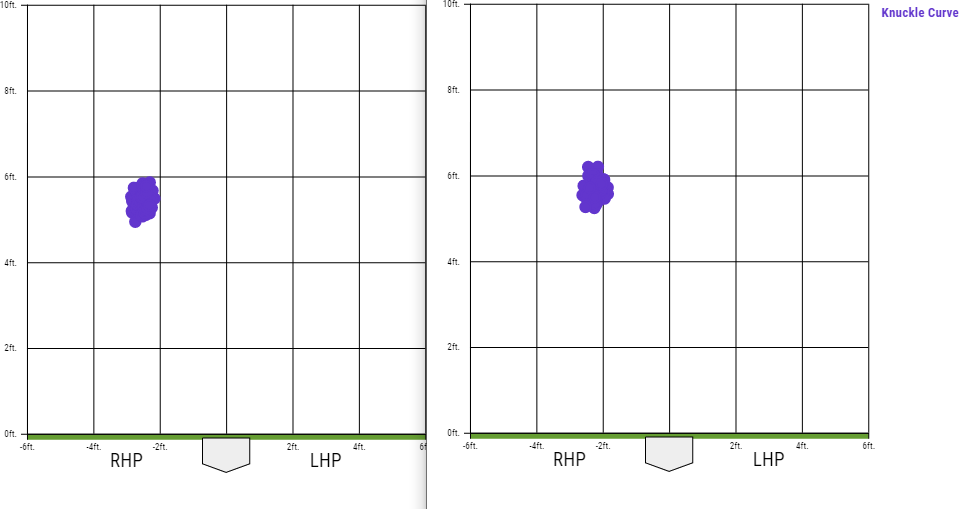
Then there's the matter of his curveball; not in how often it's been used but rather how it's been thrown. Mainly used as a weapon against left-handed bats (20% vs. 5%), the hook had an 11.1% Brl%, .411 wOBAcon, and 6.7% SwStr% in the first half. The usage stayed the same in the second half but dropped to a 0.0% Brl%, .261 wOBAcon, with a 15.1% SwStr%. Coincidence, or did Flaherty raise his release point and tighten up his movement and location?

It's unrealistic to expect another year with the numbers that Flaherty put up in 2019 but all of the above speaks more to a sticky breakout rather than a flash-in-the-pan. The only bad thing about the 24-year-old is a 21 APP that assures you must fully commit to his excellence on draft day.
Jose Berrios, Minnesota Twins
2019: 3.68 ERA, 4.68 SIERA (1.00 runs-differential)
The 25-year-old righty doesn't have the biggest run-differential on the list but his ERA was high enough that any increase would move him into dangerous territory. With a 79 ADP (SP 21) in NFBC leagues, Berrios continues to be drafted like an SP2 even though he doesn't really produce like one.
| Year | $ Value | SP Rank |
| 2017 | $10.9 | SP 33 |
| 2018 | $9.1 | SP 35 |
| 2019 | $4.2 | SP 35 |
Looking at the areas that SIERA relies on, Berrios only impresses with a 6.1% walk-rate that was 30th among starters who threw at least 100 innings in 2019. And while his 42.1% groundball-rate was a career-high, it was still only 60th among starters. His 23.2% K-rate was down two-points from 2018 but he did have a big second-half improvement, going from a 21.6% K% to a 25.2% K%. Unfortunately, it came with a 7.8% BB% in the second half that had risen three-points from the first half.
The bump in strikeouts may have been nice but his ratios went the other way. Berrios had a 3.00 ERA and 1.11 WHIP in the first half but a 4.64 ERA and 1.36 WHIP in the second half. However, his ERA evaluators didn't budge much at all, putting up a 4.39 xFIP and 4.33 SIERA in the first half and a 4.22 xFIP and 4.22 SIERA in the second half.
When you spend a top-80 pick on Berrios, what would you reasonably need from him in order to earn his price? And what do three years of earning like an SP3/4 say about his chances of doing so? The 2020 projections seem to agree that he's a bad bet in 2020:
| Projection | IP | W | SO | WHIP | ERA | $ Value | SP Rank | Overall |
| THE BAT | 197 | 14 | 187 | 1.21 | 3.96 | $11.20 | SP 34 | #116 |
| ATC | 196 | 14 | 191 | 1.24 | 4.03 | $7.00 | SP 34 | #155 |
| Depth Charts | 197 | 13 | 195 | 1.27 | 4.32 | $2.90 | SP 50 | #224 |
| Steamer | 198 | 13 | 191 | 1.29 | 4.47 | ($0.40) | SP 128 | #299 |
| ZiPS | 190 | 13 | 193 | 1.25 | 4.17 | $2.60 | SP 48 | #222 |
Frankie Montas, Oakland Athletics
2019: 2.63 ERA, 3.76 SIERA (1.13 runs-differential)
Before being handed an 80-game suspension for PEDs, Montas was in the middle of a breakout, going 9-2 over his first 16 starts, with a 26.1% K-rate and 1.11 WHIP in 96 innings. Looking at the overall numbers -as well as the key SIERA indicators - Montas performed like a completely different pitcher in contrast to his previous 97 innings:
| Season | G | IP | SO | K% | BB% | WHIP | GB% | ERA |
| 2017 | 23 | 32 | 36 | 23.7% | 13.2% | 1.84 | 35.5% | 7.03 |
| 2018 | 13 | 65 | 43 | 15.2% | 7.4% | 1.46 | 43.7% | 3.88 |
| 2019 | 16 | 96 | 103 | 26.1% | 5.8% | 1.11 | 49.4% | 2.63 |
This was because he was a different pitcher, in a sense, changing his pitch-mix and introducing a nasty split-finger fastball.
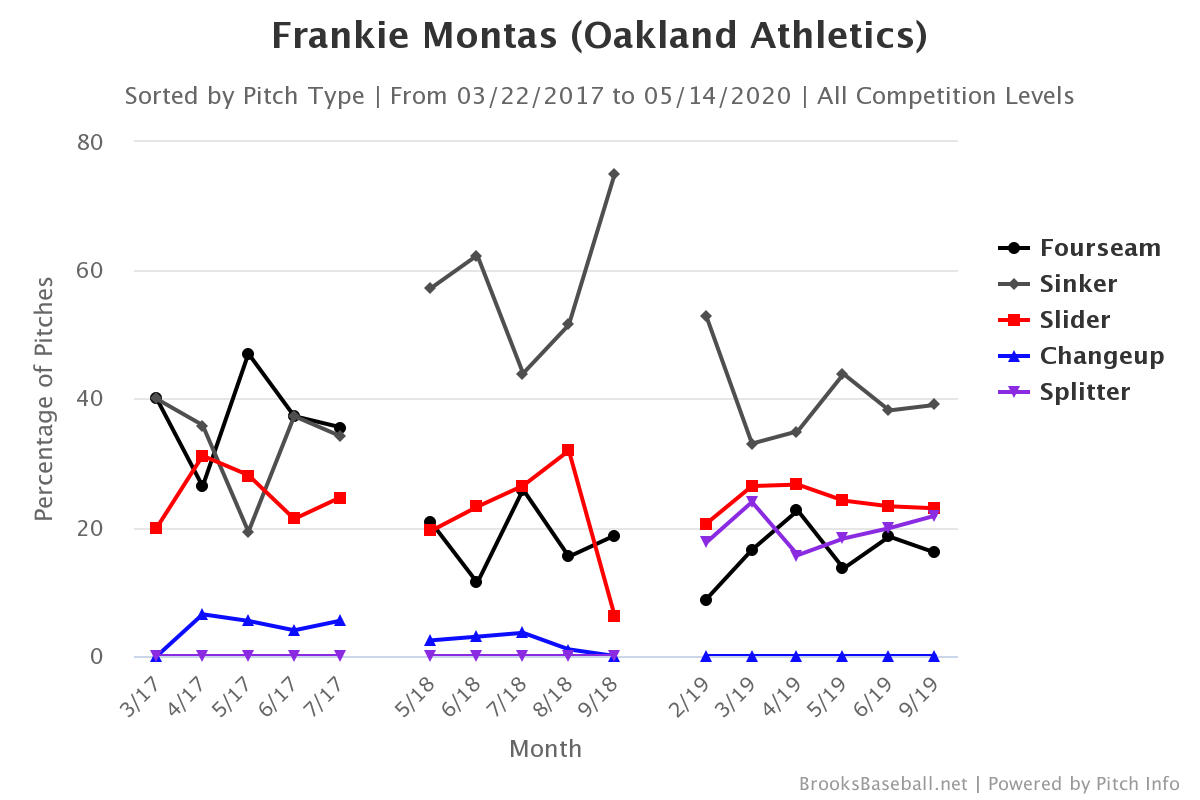
The splitty was a whiff machine - with a 21.4% SwStr% and 37.9% K-rate - and batters managed just a .160 average and a .207 wOBA against it. Montas already had a brutal slider and one that became more so when paired with the splitter, finishing the year with a 15.1% SwStr% and 38.7% K-rate. All in all, Montas was able to attack batters with high-90's heat and two elite offspeed/breaking offerings that sit around 87 mph. Is it any wonder that he saw such a dramatic shift in his performance?
To get a sense of the effect of how his splitter pairs with his other pitches, let's look at the pitch-tracking from either side of the plate. Take a look at the view from the right side, with red representing the four-seamer, orange for the two-seamer, yellow for the slider, and teal for the split-finger. The first visual is from the box and the second visual is the overhead view, with the purple balls representing the pitches when they're at their decision point:

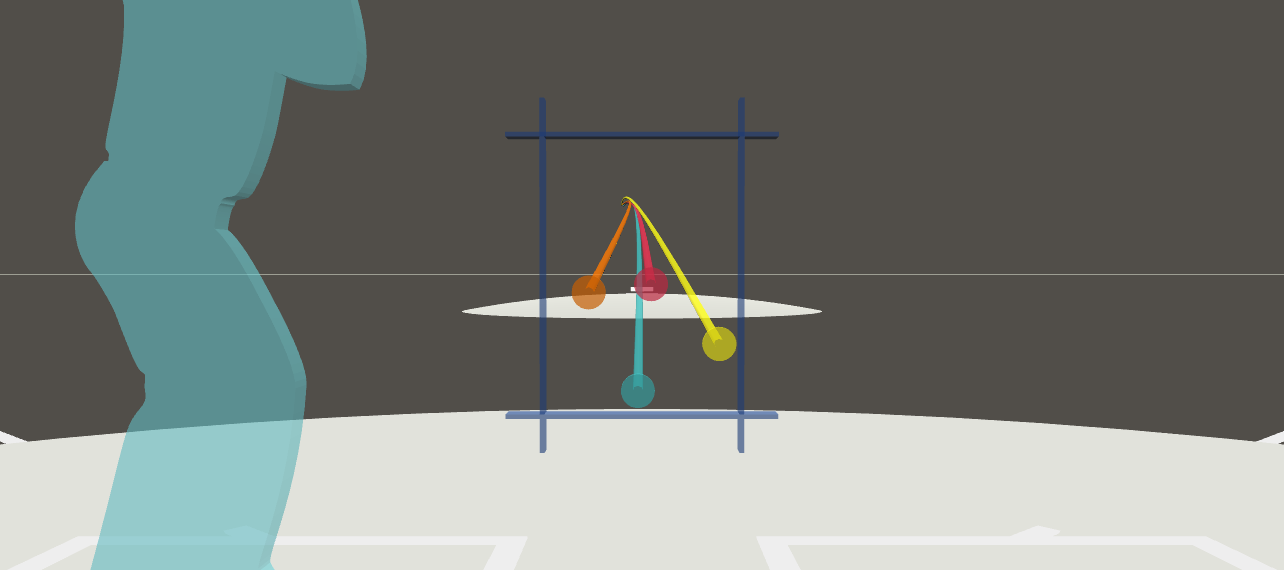
Versus left-handed batters, it's the two-seamer in orange that tunnels so well with the split-finger:


Thanks to the Pitching Ninja we can get a sense of what batters have to deal with when trying to decide if they're getting elite velocity or two of the trickiest pitches going. Here's a 100 mph four-seamer paired with an 87 mph splitter:
Frankie Montas, 100mph Fastball and 89mph Splitter, Overlay. pic.twitter.com/VLFh5017ES
— Rob Friedman (@PitchingNinja) April 24, 2019
If that wasn't nasty enough, how about an 87 mph splitter and 90 mph slider:
Frankie Montas, 87mph Splitter and 90mph Slider, Overlay. pic.twitter.com/t7UcDSH3QP
— Rob Friedman (@PitchingNinja) June 21, 2019
Not only do batters need to decide whether to commit to catching up with triple-digits but then also have to decide if the bottom will drop out or slide right by. Good luck.
Even finishing with just 96 innings, Montas finished as SP 21 and #129 overall. In 2020, he has a 101 ADP in NFBC leagues, being drafted as the SP 26 and in the same range as Corey Kluber, Sonny Gray, and Mike Soroka. Looking at the projection systems, none seem high on Montas:
| Projection | IP | W | SO | WHIP | ERA |
| THE BAT | 173 | 12 | 171 | 1.24 | 3.82 |
| ATC | 158 | 10 | 155 | 1.27 | 3.82 |
| Depth Charts | 173 | 12 | 170 | 1.28 | 3.98 |
| Steamer | 176 | 11 | 168 | 1.28 | 4.14 |
| ZiPS | 130 | 10 | 132 | 1.28 | 3.81 |
It is situations like these where one must cast a more discerning eye at projections. They (and we) have two years' worth of data where Montas was one kind of pitcher and not a very special one. Then we have 96 innings of Montas having a new and nasty pitch that turned him from a two-pitch pitcher who seemed destined for the bullpen, into a lights-out starter with elite velocity and two strikeout offerings. It's possible that the projections just haven't caught up to - or just don't believe in - this new version of Montas.
Make no mistake, there is a lot of risk in using an 8th round pick (or higher) on a pitcher who has such a short track record and recently had an 80-game suspension. However, Montas has a monster ceiling and carries significantly more upside than the pitchers being drafted in the same range. If you going to take a risk, take one who could turn out to be an ace.
More Sabermetrics & Statcast for Fantasy Baseball
 RADIO
RADIO


