Jon Anderson looks into some of the newest metrics in baseball and sees which pitchers stand out for 2023 fantasy baseball.
In the days of Statcast, we have new metrics hitting the line every year. There are so many different things we can do with the publically available data that comes out of the Statcast system.
One thing a lot of people have done is begin to isolate pitcher performance only by the movement details of the pitches they throw. This completely takes the batter out of it and gives us a better picture of what a pitcher is doing all by himself. There are positives and negatives to all of this, but undoubtedly these are interesting and useful statistics.
The long and short of it goes like this. With computer modeling, we can isolate pitch movement (release point, velocity, acceleration, where it crosses the plate, etc.) and then look at a huge sample of very similar pitches to determine what is most likely to happen with that pitch. For example, if a slider is thrown with a lot of horizontal movement and lands just an inch or so outside of the strike zone away from a right-handed batter, the chances of that pitch resulting in a swing-and-miss will be pretty high. The system assigns this probability and many more for every pitch just based on the movement - and from there we can see how pitchers are performing overall.
Be sure to check all of our fantasy baseball draft tools and resources:- Fantasy baseball draft kit
- Fantasy baseball rankings
- Team Sync platform and Draft Assistant
- Fantasy baseball mock draft simulator
- Fantasy baseball draft cheat sheets
- Fantasy baseball closer depth charts
- Fantasy baseball prospects
A popular way to do this is to separate into three categories.
- A "stuff" category. This is just about the movement of the pitch.
- A "location" category. This is about the location of the pitch.
- An overall "pitching" category. This combines the two above.
These all end up with numerical scores, with 100 being the average.
It's not super common to see this data since it's relatively new and requires a lot of advanced computer modeling. I was lucky enough to run into a guy who can do it, and that's the data I am looking at for these purposes. His name is Drew and you can follow him on Twitter here.
How Do They Correlate?
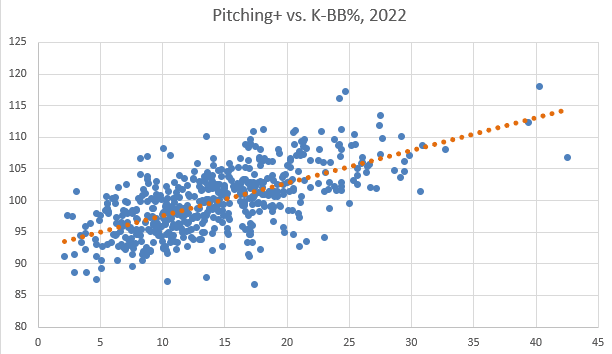
The reason we can run into trouble here is if we start holding these granular stats above long-time proven statistics like K-BB%. That will continue to be my gold standard. The good news is that these statistics do correlate:
It's far from a perfect correlation (around .68), but you can see the trend upward there (Pitching+ on the y-axis, K-BB% on the x-axis). Stuff+ correlates more with the strikeout rate since it doesn't consider the locations of the pitches at all:
The way I'm mostly using these statistics is for players with smaller samples. If we have a full season or more worth of data for a pitcher, I'm just going to trust the K-BB% over these more advanced metrics. However, for younger pitchers that we haven't seen a ton of, we can get a little bit of signal from these statistics since they stabilize extremely quickly (if a guy throws five fastballs, you've seen his fastball - that's pretty much how it's going to move every time).
So once again, shout out to Drew for modeling this and letting me use his data. You can check it all out here on this web app he developed. Let's get into the numbers!
Top Pitchers Leaguewide by Stuff
| Pitcher | Stuff | Location | Pitching |
| Josh Hader | 206 | 93 | 112 |
| Pete Fairbanks | 179 | 102 | 118 |
| James Karinchak | 176 | 95 | 105 |
| Kenley Jansen | 175 | 100 | 116 |
| Emmanuel Clase | 171 | 104 | 117 |
| Jordan Hicks | 168 | 93 | 99 |
| Liam Hendriks | 167 | 96 | 106 |
| Matt Brash | 167 | 97 | 103 |
| Ryan Helsley | 167 | 96 | 109 |
| Colin Poche | 166 | 94 | 107 |
So this certainly checks out with some of the league's toughest relievers at the top of the "stuff" leaderboards. We aren't as concerned with relievers, but the same trend continues if you limit it to starters. The top stuff marks for players that exceeded 100 innings last year were Corbin Burnes, Shohei Ohtani, Spencer Strider, Gerrit Cole, and Dylan Cease. Bonafide aces.
Now let's drill into some players that stand out the most.
Hunter Greene, Cincinnati Reds
| ADP | Stuff | Location | Pitching |
| 114 | 139 | 100 | 106 |
In case we needed any more hype on Hunter Greene, he is a standout here. His stuff is 39% better than the league average and there are no issues currently with his locations. We pretty much already knew this since we've seen him regularly hitting 100 miles per hour with his fastball and earning that 30.9% K% last year.
Everybody knows Greene is filthy, but here's some more evidence of it just in case you needed it.
Blake Snell, San Diego Padres
| ADP | Stuff | Location | Pitching |
| 119 | 133 | 100 | 107 |
Another non-surprising name here, but I want to give you all of these names with elite stuff marks but lower ADPs. Snell is going around pick 120 these days, and with the injury and command troubles we have seen from him in the past, that makes sense. However, he stayed mostly healthy last year (128 innings) and improved on the command (9.5% BB%, league average location value above).
He has the potential to put up an ace season in 2023, and you don't have to pay a ton for him.
Nick Lodolo, Cincinnati Reds
| ADP | Stuff | Location | Pitching |
| 126 | 127 | 98 | 98 |
He is a step behind teammate Greene, but another standout in these advanced metrics. Lodolo is super tough to hit, but he does have a bit of a history of high walk rates, although it wasn't much of an issue in the Majors last year at 8.5%. The plus with Lodolo is that he's a ground-ball pitcher as his most common pitch is the sinker. That's a pretty big help in Great American Ballpark, so you might want to take him over Greene and Snell for those reasons - and he goes 10 or so picks behind these guys.
Dustin May, Los Angeles Dodgers
| ADP | Stuff | Location | Pitching |
| 153 | 140 | 98 | 104 |
Very few starting pitchers have better stuff ratings than May, but it's the same old story here with the injury and command questions. He has not thrown anything close to a full season in professional baseball since 2019, which is a concern. However, it's another massive upside option here and this time it's after pick 150.
Jeffrey Springs, Tampa Bay Rays
| ADP | Stuff | Location | Pitching |
| 172 | 101 | 105 | 109 |
Drew Rasmussen, Tampa Bay Rays
| ADP | Stuff | Location | Pitching |
| 185 | 118 | 103 | 105 |
Two guys in a very similar boat here. Springs and Rasmussen both had breakout seasons last year, entering the Rays rotation and pitching very well. Neither of them blows you off the page with their strikeout numbers, but they are both pretty strong and you can see them trading out as above average in all three respects here - that's a very good sign, and it makes their price tags look pretty questionable.
Garrett Whitlock, Boston Red Sox
| ADP | Stuff | Location | Pitching |
| 292 | 126 | 100 | 106 |
Whitlock did not get great results as a starter, but the pitches still modeled very well. And yes, the numbers above are only from the games he was in the starter role. He is one of my potential breakout SPs, and this makes me feel pretty good about that!
Michael Kopech, Chicago White Sox
| ADP | Stuff | Location | Pitching |
| 291 | 125 | 96 | 101 |
Kopech has a live arm and really can do some crazy things with the fastball when he needs it (ramped up to 99 miles per hour a few times last year). The metrics here paint a pretty picture, but nothing else that came out of his 2022 season really gave us a ton of reason for optimism. He has a long history of injury and a limited pitch arsenal, but here is some evidence that he could have a much better go at it in 2023.
Brayan Bello, Boston Red Sox
| ADP | Stuff | Location | Pitching |
| 320 | 122 | 97 | 99 |
Another one of my breakout pitcher picks, Bello stands out by the stuff metrics. He has an elite changeup and a good, heavy sinker. I like his prospects for the future a bunch, but he does have some trouble with command (10.1% BB% last year across all levels). I'm not assured that he will have a useful fantasy season in 2023, but I know the price is way cheap enough to take a shot at it.
Kyle Bradish, Baltimore Orioles
| ADP | Stuff | Location | Pitching |
| 372 | 123 | 99 | 98 |
Bradish was a trendy breakout pick last year as he debuted early in the season, but he struggled mightily with a 4.90 ERA, a 1.40 WHIP, and a low 22% K%. He performed better over his last seven starts with a 3.34 ERA and a 1.11 WHIP - however, that was without any improvement in the K% (21%). I don't really know what to think about Bradish, but the stuff metrics seem to imply there's some upside here.
Ken Waldichuk, Oakland Athletics
| ADP | Stuff | Location | Pitching |
| 388 | 115 | 96 | 102 |
Waldichuk goes really late in drafts despite the positive numbers he showed us last year and that we see here. The reason for that is because of the concerns about innings, wins, and quality starts being a young pitcher on a very bad team. The arsenal doesn't seem to be a problem here, and he might just be the bright spot of another bad 2023 season for the A's.
There you have it, a bunch of cheap pitchers with upside to consider for 2023. Hope you enjoyed this piece, talk to you next time!
Download Our Free News & Alerts Mobile App
Like what you see? Download our updated fantasy baseball app for iPhone and Android with 24x7 player news, injury alerts, sleepers, prospects & more. All free!

More Fantasy Baseball Year In Review


 RADIO
RADIO


