


 RADIO
RADIO
Jon Anderson outlines his process for selecting which teams to stack in MLB DFS with some data-driven insights from prior seasons.
If you have played MLB DFS for any length of time, you've certainly dabbled in stacking. Stacking means putting multiple players from the same offense into your lineup with the hope that the offense scores a bunch of runs and you rack up fantasy points while they're at it.
There are a lot of different opinions that you'll hear out there about how and when to stack. I wanted to dive into the data and see what insights I could find that are backed by actual results.
In my personal archives, I have a data set of every MLB box score along with each player’s DraftKings salary and points output for the last six seasons. In this data set, I have a row for every individual game each player has played with their full line score and DraftKings information. Included in this is the opposing starting pitcher each lineup faced along with that pitcher's daily salary. With this much data, there is a lot to learn. I tried a few things out, and here we go.
Featured Promo! Save 50% on any PGA Premium Pass using discount code MASTERS, this week only! Win more with our DFS and Betting Packages, get expert tools and advice from proven winners including the Lineup Optimizer, Research Station, betting/props cheat sheet and more. GAIN FULL ACCESS HERE
Which Pitchers to Target?
The most impactful factor that will go into most people's stacking advice is opposing starting pitcher. If a lineup is facing a bad starting pitcher, their run projection will be higher, which makes them more likely to bust out for a ton of fantasy points.
The price point of a pitcher tells us a heck of a lot, considering the DFS websites have a lot of incentive to get the pricing right in order to make the game as competitive as possible (if the pricing is wrong a lot, the best players will exploit that and will soon be winning all of the money leaving very little for the casual player - which is not what these companies want). This results in players just being able to look at opposing pitcher salary to get a good feel of which offenses will have good and bad nights.
So I wanted to test how good the pitcher price actually is at predicting offensive performance. For every non-extra innings game played where DraftKings salaries were available from 2015-2019 (leaving out 2020 just because of the short season), I did the following:
- Rounded each pitcher salary to the nearest $500 mark (just to give us more groupings to look at)
- Summed up the opposing offense’s DraftKings points
That generated a data set with each team’s offensive output along with their opposing pitcher and his salary. There are nearly 15,000 games represented in the data. The top three scores look like this:
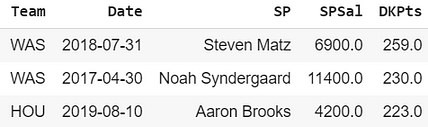
So this means that on July 31, 2018, the Nationals hitters collectively scored 259 DraftKings points in a game that was started by Steven Matz, who was priced at $6,900 that day.
The teams above scored 25, 23, and 23 runs in those games respectively. Needless to say, you would’ve done pretty well if you had a few stacks of those offenses on those days.
To get a feel for the big picture here, I all 14,000 some rows, rounded each pitcher salary to the nearest $500 and then found the average team DraftKings score against each pitching price point. Here is the plot:
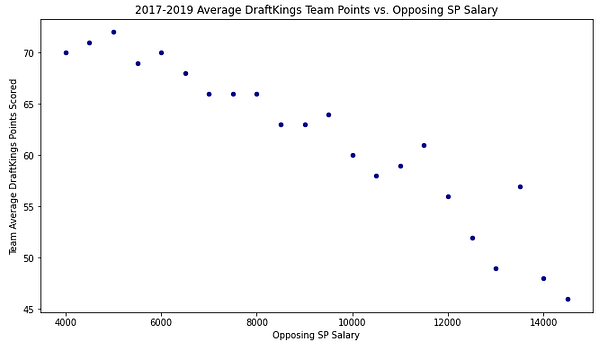
Unsurprisingly, teams do very well against very cheap opposing starters, averaging around 70 team DraftKings points when they face a pitcher priced around $5,000. Along the same vein, they do very poorly against the most expensive starters.
You can see the dot jump up at the $13,500 mark, meaning that hitters have done much better against those pitchers than even the cheaper $12,500 and $13,000 pitchers. That is due to the limited data we have at that price range. There have only been 75 instances of a pitcher being priced that high, which makes the data less reliable.
While there is certainly an obvious downtrend, there does not seem to be much difference at all between pitchers separated by $500-$1000. Teams have performed the same way against $8,000 pitchers as they have against $7,000. The same is true in the $10,000 — $11,000 range, just not much of a noticeable difference there.
If we round the pitchers to the nearest $1,000 instead of $500, here’s what we see:
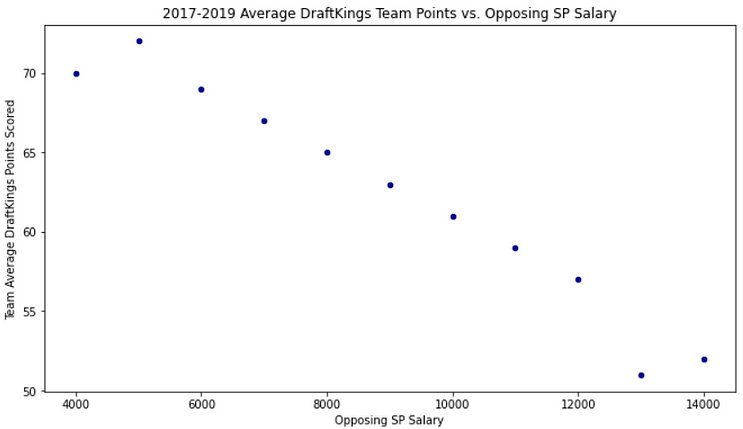
Once again, the extremes of the plot can be a little wonky because of the lack of data. There have not been many $4,000 or $14,000 starters, so those dots being out of line does not mean much of anything.
To show this a different way with a little more detail, I developed a box plot of the distribution of team scores against each pitcher's salary, rounded to the nearest $1,000. For each price point, you’ll see a box, a line, and some dots above the top line.
75% of the data points will be within the range of the box, and 95% of the data points will be inside the vertical line. The dots you see above the top line are the 5% of outliers scores, in this case — very high scores. For more on boxplots, check this out. Here is the plot:
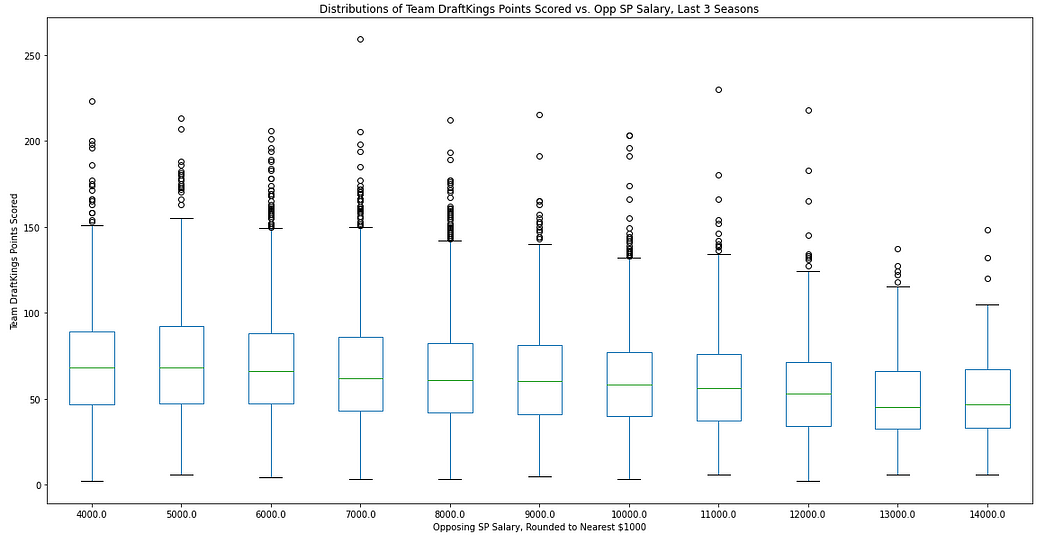
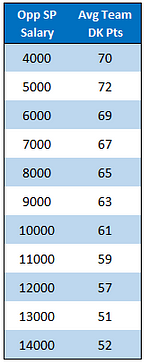
The green line you see is the average team score against each opposing starting pitcher's salary. Here are the averages in table form:
What you can see by the box plot is that you typically get those outliers, the tournament-winning scores, from teams facing a pitcher below the $8,000 mark.
In conclusion, stacking against the cheapest opposing pitchers is a good idea, and stacking against the most expensive is a bad idea. That's a big "no duh!", but one actually useful thing to notice is that there is not a significant difference in the big picture between stacking against a $7,000 starter and a $9,000 starter. The middle-tier pitchers in price give up outlier scores at remarkably similar rates, making it actually more profitable over time to stack against the pitchers on the more expensive side of that (due to lower ownership and possibly cheaper hitter prices).
Lineup Spot Correlations
After you have chosen a team to stack, the next question becomes how exactly to do it. Typically selecting 3-5 hitters from a lineup would be considered a "stack", so which ones should you be choosing?
First, let's look at the average outputs for each lineup spot:
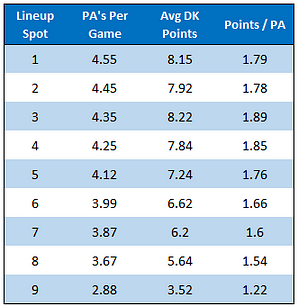
You can see here that you get about 0.1 fewer plate appearances per game for every spot you drop in the lineup. The best fantasy point producers on a per plate appearance basis have been the #3 and #4 hitters, however the extra plate appearances the 1 and 2 hitters get actually turns into more DraftKings points per game.
This shows how important it is to focus on hitters hitting in the top four of the lineup. If a guy that typically hits lead-off drops down to the seven spot for a game, you should be expecting one fewer trip to the plate for him on average, which is a huge difference since you're typically only getting five from the hitters you draft.
Next, I checked on how each lineup spot correlates with the other. The idea here is that by drafting two hitters hitting very close to each other, you could get added points from one driving in the other, and things like that.
First, I tried it the old-fashioned way. I picked ten different pairings of lineup spots and made two lists of all of the DraftKings scores that those lineup spots have produced over the last five years, and I saw what the correlation coefficients were. With so much data, these numbers should be somewhat reliable. I did not expect any real correlation to develop, but we can learn something just by how they fared against each other. Here are the results:

In statistics, you would not say two variables are correlated at all until you saw a coefficient of 0.3 or so, but that does not mean that we can’t learn something here. The order of the pairings does make sense. The most correlated pairs are closer in the batting order to each other than the least correlated. The 1–2 pair is the clear winner here, with a big gap between it and the second-place pair. The top three hitters all being in the top three most correlated makes a lot of sense to me because of the fact they are all guaranteed to bat in the same inning at least once. No matter what happens, the first three hitters will all come to the plate in the first inning. After that, it's pretty random.
The second way I tried this out was to isolate each of the top five lineup spots, find the games where that spot did very well, and then see how that big game affected the lineup spots around it.
First, I checked what happened to each position’s average DraftKings score when each spot went over 10 DraftKings points. Here are the results:
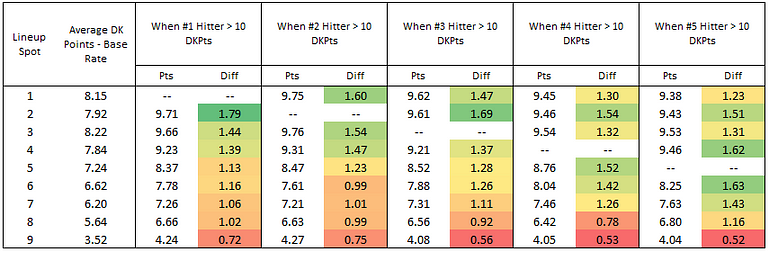
So the way to interpret this is to look at the first grouping of colored numbers there. That box tells you that when the lead-off scores more than 10 DraftKings points, the #2 hitter sees the biggest benefit, jumping up 1.79 points over the average for #2 hitters. You can see how the numbers all descend in order after that.
In every case but the #4 hitter, the biggest beneficiaries of a hitter going off are the hitters immediately before and after him, and it’s a significant difference from the hitters more than one spot removed. Interestingly, the #3 hitter doesn’t get much of a benefit when the #4 hitter has a big game, probably because of a lot of three-up three-down first innings.
I did the same thing again, but checked when each hitter went over 14 DraftKings points:
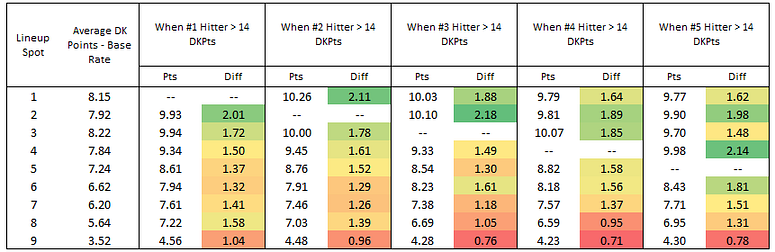
The #2 hitter really thrives when the #3 guy has a big game, going 2.18 points over his average. Interestingly, the players that hit before the guy that goes over 14 DK points actually see a bigger boost in scores than the player who follows him in the order. Typically, if you’re going to get 15 DK points or more, a home run is involved — so this makes some sense because a home run never helps the guy batting next.
In conclusion here, it makes the most sense to stack hitters all hitting consecutively in the lineup. The 1–2 is your best pair. Always consider the base rates — the #1 and #3 hitters score the most points per game on average, so they also stand to benefit most from a whole team busting out. So while it's probably just what you would have guessed, the best four-man stack would indeed just be the 1-4 hitters. Sometimes in life, things are as simple as they seem.
How Often Do Teammates Lead The Day?
If you want to really make some money playing DFS, you need to post massive scores in tournaments. You don't want a stack that performs 10% better than the average, you want the stack that includes several hitters at or near the top of the daily leaderboard.
For this test, I looped through every day of 2019, using only days that had 10 or more games on the slate, and checked to see how often teammates were in the top X of hitting scorers for the day. Here are the results for 2019:
Percent of the time that two or more teammates finished in the top 20 hitters: 100%
Percent of the time that three or more teammates finished in the top 20 hitters: 86%
Percent of the time that four or more teammates finished in the top 20 hitters: 33%
Percent of the time that five or more teammates finished in the top 20 hitters: 6%
Percent of the time that two or more teammates finished in the top 10 hitters: 94%
Percent of the time that three or more teammates finished in the top 10 hitters: 28%
Percent of the time that four or more teammates finished in the top 10 hitters: 5%
Percent of the time that two or more teammates finished in the top five hitters: 46%
Percent of the time that three or more teammates finished in the top five hitters: 7%
Percent of the time that the top two hitters of the day were on the same team: 10%
Percent of the time that the top three hitters of the day were on the same team: 2%
I checked these numbers for 2018 and 2017 as well, and the percentages were basically identical.
Home or Away Team?
Another thing you will hear DFS analysts pontificating about is concerning home or away team. An idea you will hear a lot is that it's better to stack a road team because they are guaranteed to bat in every single inning, while sometimes the home team will not get 9th inning at-bats if they are already winning the game. I decided to test this out as well.
Home Team Win More
Everybody is probably aware of the "home field advantage", but here's a number to put on it: 53%. So yes, the home team is more likely to win, but only marginally so. It's also not true that every time the home team wins, they will get fewer plate appearances, as a small share of the wins come in walk-off fashion in the 9th inning or beyond.
It is true that the teams that are most commonly stacked are huge Vegas favorites, and huge Vegas favorites do inherently win more often, so the 53% would be pushed upwards in these specific examples.
Plate Appearances
Just because you don't bat in the 9th inning does not mean you will not outdo your opponent in plate appearances. The winning team will most of the time send more hitters to the plate just by virtue of having scored more runs.
I checked the numbers, and on average the home team sees 4% fewer plate appearances than the road team. An average game is about 36 plate appearances. 4% of 36 is 1.4, so on average, you should only expect to see 1.4 fewer plate appearances from the home team. That's not nothing, but it's also not something that should have you running for the hills instead of considering stacking a home lineup.
Production
This is really the only thing that matters. A hitter can score 20 DraftKings points with one swing of the bat, which is worth about eight plate appearances of average production. Let's talk about raw DraftKings points outcomes. In 2019, road hitters scored 166,121 DraftKings points. That was 1.6% more than the home hitters total of 163,460. When you look at the per plate appearance numbers, it's 1.79 for home hitters vs. 1.75 for road hitters, a 2.2% increase. So yes, home hitters were better than road hitters, but not nearly enough to make up for the 4% dip in opportunity.
In 2018, things were much closer. Home hitters scored about 1% fewer total points than road hitters. 2017 was back up to 2%. Here is all of this broken down:


The conclusion is that yes, road hitters do see more opportunity, however, the home hitters make up a lot of that with better production. It's essentially a negligible difference between home and road hitters, so you should not let that factor into your stacking choices. In fact, it may be more profitable to favor the home team since it's possible other players will buy into the idea that you should not do that.
Wrapping It All Up
It is largely what we all suspected in the first place, stacking is a super viable DFS baseball strategy. Here are all of my results from above in a nice easy-to-read bullet form.
- On any given day (on a normal-sized slate), there is a 94% chance that two or more teammates will find themselves in the top ten hitters of the day.
- There is a 46% chance that two or more teammates will find themselves in the top five and a 10% chance that two teammates will be the top-scoring hitters overall.
- The best two-man stack is to do a 1–2 stack, the best three-man is a 1–2–3 stack.
- The best lineup positions to be in are the lead-off and #3 spots.
- Target the cheapest opposing starting pitchers, but if targeting a more expensive pitcher, lean towards the $8000-$9000 pitchers as they give up about the same scores as the $7000-$8000 pitchers, and ownership and hitter prices will likely be lower
- Home vs. road lineups is not something that is statistically significant enough to worry about.
Download Our Free News & Alerts Mobile App
Like what you see? Download our updated fantasy baseball app for iPhone and Android with 24x7 player news, injury alerts, sleepers, prospects & more. All free!