


 RADIO
RADIOAriel Cohen uses his ATC fantasy baseball projections, the most accurate for two straight years, to identify 1st round targets and risks for 2022 MLB drafts.
Today’s article will attempt to give the reader a few new perspectives on player risk. I will attempt to enhance your understanding of projections, and at the same time seek to form a more complete picture of each player.
To do this, I will first color in your understanding of the makeup of the ATC projections more vividly. First, what is a fantasy baseball projection?
Note that this article was originally published on February 2nd.
Featured Promo: Save 50% the regular price with discount code SUMMER, for a limited time. Exclusive access to our Team Sync platform, DFS cheat sheets, Lineup Optimizers, betting/prop picks, and exclusive content from Nick Mariano and Eric Cross! GAIN ACCESS NOW
Projections Explained

Above are two examples from Nick Mariano’s excellent CUTTER projections. Mike Trout is projected to hit 35 home runs and bat .286 on the season. Nick projects that Bryce Harper will steal twelve bases and score 100 runs.
Nick is not insisting that Mike Trout will hit exactly 35 home runs in 2022. Predicting that level of detail is an impossible task. He may hit 40 HR or only 30 HR. Trout could get seriously injured in May and end the season with only five round-trippers.
No, that 35 home run projection is not a prediction – it is an assertion of Trout’s true talent level. There is always a range of possible outcomes, and Nick is quantifying the most likely outcome. But 40 HR might be an 80th percentile outcome, and 30 HR might be the 40th. CUTTER is saying that the long-term average (or median) of the range of Mike Trout’s 2022 home run ability is to hit 35 of them.
Due to the 162-game season sample size, there will always be variations above and below a player’s true average/median expectation. A bit of good luck in one season could produce three more homers, while extreme bad luck may take away seven.
The term for the inherent variance due to sample size is known as process risk.
But what if CUTTER was wrong about a player’s projection? Perhaps THE BAT (Derek Carty’s forecasting system) and its 41 HR projection for Trout was the more accurate forecast of his true talent? What if ZiPS’s 29-HR forecast (Dan Szymborski’s model) was truly the better long-term bet?
The term for the uncertainty of the true expectation is referred to as parameter risk.
Process risk cannot be materially minimized, nor should it – but parameter risk has a chance to be reduced. One major strength of the ATC projections is their ability to reduce parameter risk. By utilizing and combining many sets of expectations, ATC reduces the risk of relying on any single projection system.
The ATC Projections
Let’s start out with a quick review of how the ATC Projections are generated.
The Average Total Cost projection system (ATC) gets its name from the fact that it “averages” many other projection systems together. ATC also happens to be my initials.
However, ATC goes a step further than purely applying a simple average. Rather, ATC assigns different weights to different underlying projection models based on the careful study of historical performance. ATC is a “smart” aggregation model.
The methodology behind ATC is similar to what Nate Silver does with his presidential election forecasting at www.fivethirtyeight.com. Nate collects lots of polling data. He assigns credibility weights to each firm in order to know how to combine them.
ATC calculates different weights for each statistic that it projects. System A might receive 15% of the weight for batter homeruns, but only 5% for pitcher strikeouts. System B may receive 10% for HR, but 20% for K, etc. The ATC system incorporates many freely available projections, plus prior MLB statistics over the past three seasons.
Last year, for the second straight year, FantasyPros crowned the ATC projections as the most accurate fantasy baseball projections.
Projections Volatility
Today’s article is centered around providing more color and shape to the distribution of projections that underline ATC.
As described in the previous section, ATC looks at many individual projection sets. For some players, projections are largely in agreement with one another. For others, projections are more divergent. As projection sets differ, we can observe the intrinsic variance between them. Measuring the range of differing projections, allows us to quantify part of each player’s parameter risk.
Aside for simply knowing the magnitude of the divergence, it is important to know which way projections differ. For some players, there may be one or two outlying projections above or below the ATC average. For some players, projections are equally just as high as they are low.
To helps us quantify these items, ATC has developed two additional helpful risk metrics. The formal definitions of them are as follows:
- Inter-Projection Standard Deviation (InterSD) – The standard deviation of the underlying projections surrounding the ATC average auction value. InterSD describes how much the projections disagree about the value of a player. The larger the InterSD, the more projections differ.
- Inter-Projection Skewness (InterSK) – The skewness of the underlying projections surrounding the ATC average auction value. InterSK describes the symmetry of the underlying projections. A positive InterSK means that a player’s mean is being pulled to the upside; the majority of projections are lower than the ATC average. A negative InterSK means that a player’s mean is being pulled to the downside; the majority of projections are higher than the ATC average.
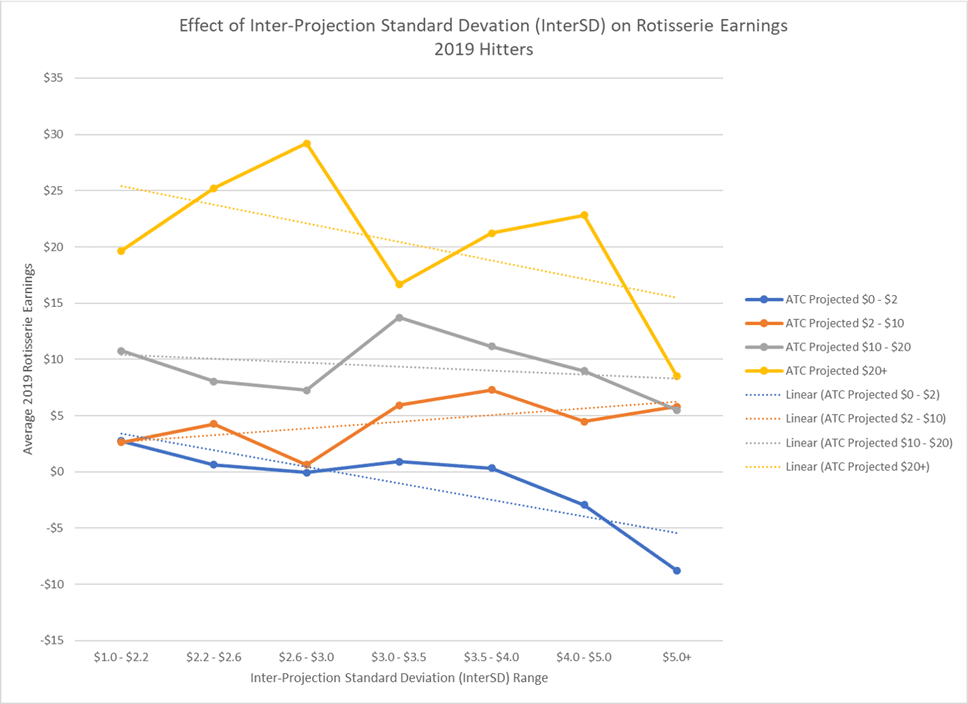
For hitters, my research has shown that inter-projection standard deviation (InterSD) is negatively correlated with expected rotisserie earnings. The higher the variance in-between projections, the lower the expected returned end of season values for most value ranges.
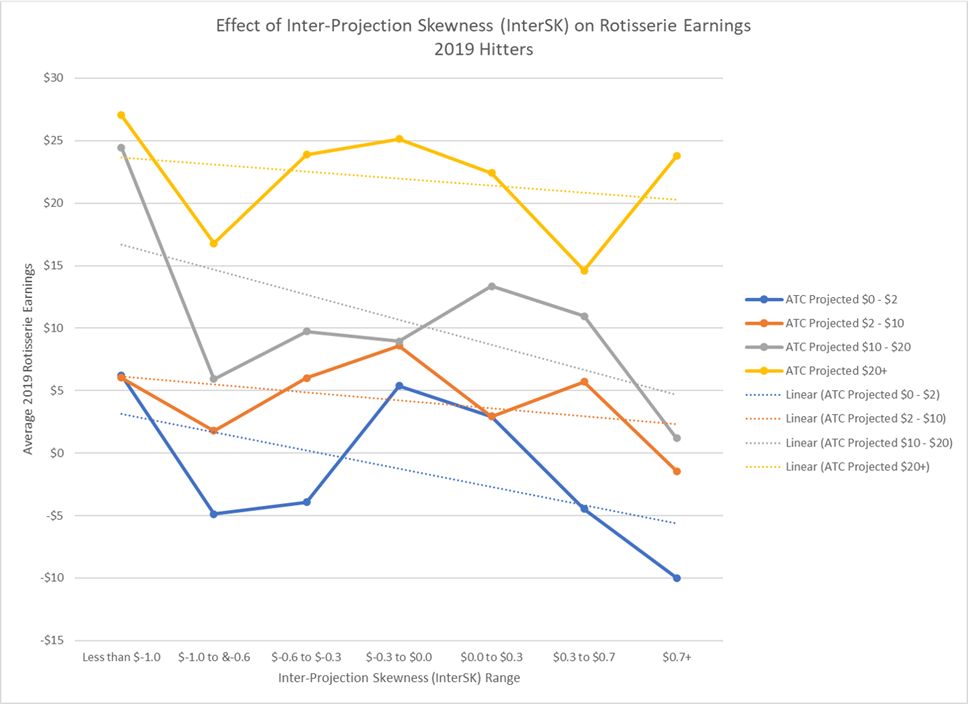
In terms of skewness (InterSK), negative values are superior to positive ones. Players with high positive skewness are at risk for a lower returned end of season value, while players who demonstrate a large negative skew have shown the tendency to out earn their ATC projected statistics.
For more background and research, see the full introductory ATC projections volatility article.
NFBC ADP Grid – Position Scarcity
Prior to our visual demonstration of the ATC volatility metrics for 2022, let’s set the stage with the mode of presentation. One of the best ways to visualize the player pool is an Average Draft Position (ADP) grid.
To remind the readers, a player ADP is formed by taking the average of the most recently available [actual] league drafts for a particular format. For example, if Player X has an ADP of 24 – it means that on average, league drafters have been selecting Player X with the 24th overall selection.
An ADP ranking is a sorted list of all player ADPs. If a Player Y has an ADP ranking of 55, it means that Player Y has the 55th highest ADP of all recently drafted players.
Currently, the National Fantasy Baseball Championship (NFBC) is the gold standard of ADP data. The site hosts a large number of money leagues (a large number of meaningful data points) throughout the baseball offseason. It then publishes updated draft results daily.
Below is a visualization of the NFBC ADP rankings for Draft Champion leagues over the past month (Note that this article was originally published on February 2nd):

Click image to enlarge
Player positions in the above grid are colored by the following key:
![]()
The position scarcity ADP grid is helpful. One can visually inspect that six pitchers have an average draft price located in the fifth round, and that four pure first basemen have been selected on average in the first four rounds of recent drafts, etc.
The grid will enable us to locate and analyze players by round when we talk about risk in the coming sections.
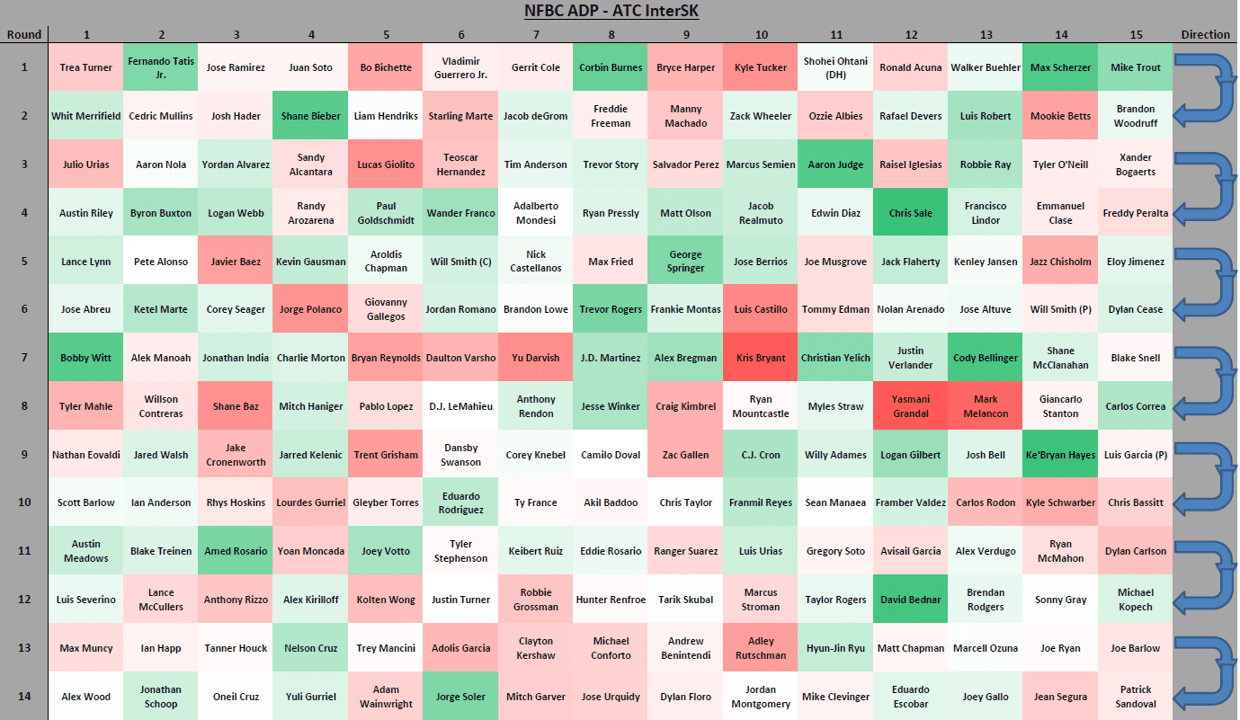
NFBC ADP Grid – ATC InterSD

Click image to enlarge
Above is the same NFBC ADP grid, but rather than the positional display - players are colored (and shaded) by their ATC Inter-projection standard deviation (InterSD). Players colored in green have low InterSD values, while players colored in red have high ones.
To remind the reader, the InterSD is a proxy for a player’s parameter risk – and illustrates how different ATC’s underlying projections are from one another.
The lowest InterSD in the first 14 rounds is Jonathan Schoop at 1.3, and the highest InterSD is 9.0 for Justin Verlander. The average InterSD in these rounds is 3.4, which roughly indicates a risk-neutral player. Trent Grisham, Marcus Stroman, Gleyber Torres and Liam Hendricks are examples of risk-neutral players for parameter risk.
InterSD Player Notes – 1st Round
In the first round, the players with the lowest parameter risk are Bo Bichette (1.7) and Kyle Tucker (2.1).
For Bichette, his short but stable track record has led to the near uniformity of projections. For almost every underlying system – Bichette's batting average lies between .285 and .300.
This excellent risk result for Kyle Tucker invites me to pay more attention to him. Although his ATC value is below his market price, seeing a 2.1 InterSD gives me confidence that his value floor is relatively high.
In the first round, InterSD values are highest for Shohei Ohtani (6.4) and Walker Buehler (6.7). [Please note that I am referring to only the hitter statistics for Ohtani at this time.]
I wasn’t surprised to see the reigning AL MVP’s name here. After an incredible 2021 – it is wise to bet on regression. However, not all projection systems agree. Many still project 40+ HRs for Ohtani in 2022, while others regress him into the low 30’s. With a high strikeout rate (30% in 2021), his future batting average also remains a question. What also adds to his uncertainty - is the question of playing time. Projections do not agree with how often the Angels will utilize his DH skills in the coming season.
Walker Buehler is a particularly important player to understand why his InterSD is high.
| Season | IP | ERA | FIP | xFIP | SIERA |
| 2017 | 9.1 | 7.71 | 5.94 | 3.92 | 4.47 |
| 2018 | 137.1 | 2.62 | 3.04 | 3.21 | 3.31 |
| 2019 | 182.1 | 3.26 | 3.01 | 3.37 | 3.50 |
| 2020 | 36.2 | 3.44 | 4.36 | 3.93 | 3.80 |
| 2021 | 207.2 | 2.47 | 3.16 | 3.57 | 3.73 |
| Total | 573.1 | 2.90 | 3.20 | 3.45 | 3.57 |
Source: FanGraphs
Take a look at Buehler’s ERA and ERA estimator history above. You will see that in every season since 2018 – most of his earned run estimators are not only higher than his ERA … they are much higher. Last year’s 2.47 ERA was over a run lower than both of the corresponding xFIP and SIERA indicators. A six tenths of a run career difference between ERA and SIERA cannot sustain indefinitely.
Because of the large difference over the past few years, there is the potential for the various projection algorithms to see Walker’s future very differently. Notice that I did not say poorly … just differently. Some systems who rely on SIERA (or SIERA type indicators) will view Buehler far worse in 2022 than a system who credits his run limiting abilities as a skill. He is a tougher player to predict, which is seen through his large InterSD.
There are many positives to Buehler’s game and numerous reasons to still select him high up in drafts. However, it is clear that he has outperformed his component metrics for the past few years. Indeed, he is a prime example of a pitcher whose true talent level is far more unknown than some other similar starters.
Take caution this year in selecting the exciting Dodger in the first round of drafts … you may or may not be rostering a true first-round talent.
In the first round of drafts, minimizing player downside risk is particularly important. There is an old rotisserie adage that says, “you can’t win your league in the first rounds of a draft … but you can lose it.” InterSD should be taken into consideration more greatly on the downside than on the upside.
NFBC ADP Grid – ATC InterSK
The ATC InterSK volatility metric provides an even clearer picture on how the underlying projections differ … not just if they differ.
Positive-skew (or right-skew) occurs when there is a longer tail on the right side of a distribution. It is when the median of the distribution is lower than its average. In ATC terms, positive-skew means that more of the underlying projections are found lower than what ATC indicates.
Negative-skew (or left-skew) is the reverse. It is when the median of the distribution is to the right of the average, and there is a longer tail to the left. For ATC – more projections appear higher than the indicated ATC average value.
As seen above, negative-skew is preferred to positive-skew. All things equal, you should want to draft a player where the wisdom of the crowds is better than the ATC average.
It is also important to note that that InterSD is far more important than InterSK. The amount of variance between the projections trumps the shape of the tail. In mathematical speak - InterSD is a second-order distribution statistic, while InterSK is third-order.
Of course, it is without saying that the ATC average (a first-order distribution statistic) is far more important than any of the ATC volatility metrics. A $25 player with a wide disagreement in projections is clearly better than a $5 player with little disagreement.
In the ADP risk grid chart below, players are colored (and shaded) by their ATC Inter-projection skewness (InterSK). The negatively skewed player distributions are colored green, while the positively skewed ones are colored red.
Click image to enlarge
InterSK Player Notes – 1st Round
The players with the most negatively-skewed distributions in the first round are Fernando Tatis Jr., Corbin Burnes, Max Scherzer and Mike Trout.
Of these four individuals, Mike Trout is the only one that also has a below average InterSD value. That is to say, Trout’s projections are fairly in agreement with each other … and on the whole – they are better than what ATC indicates. While Trout’s waning stolen bases make him troublesome to draft in the first round of rotisserie leagues [due to roster construction concerns] – it is encouraging to note that his ATC volatility metrics are quite safe. The perennial stud interests me particularly in auction leagues and in points leagues.
On the other side – the players with the most positively-skewed distributions in round 1 are Trea Turner, Bo Bichette, Bryce Harper, and Kyle Tucker.
There isn’t anything actionable to walk away with for these players here [from InterSK]. Turner and Harper’s right-skew is slight, and their InterSD values are fairly neutral. I would not factor InterSK into any buying decisions for them at this time. For Bichette and Tucker, this is a case where InterSD trumps InterSK. On the whole, these are fairly safe picks from a parameter risk perspective.
NFBC ADP Grid – ATC IntraSD
Finally, I want to introduce one final type of risk that can be more formally quantified. ATC has developed a third risk metric that looks at categorical differences. The formal definition of this new risk metric is as follows:
- Intra-Projection Standard Deviation (IntraSD) – The standard deviation of a player’s categorical Z-Scores. IntraSD is a measure of the dimension of a player’s statistical profile. The smaller the IntraSD, the more balanced the individual player’s category contributions are. The larger the IntraSD, the more unbalanced the player’s category contributions are.
While inter-projection volatility serves to quantify the parameter risk of projections, the intra-projection volatility deals with the player’s categorical or profile risk. The smaller the categorical risk of the player, the less effect that any single component of the player’s profile will have on his total rotisserie value.
Another way to think about categorical / profile risk is in the case of underperformance, injury, or other absences. Take Adalberto Mondesi, for example. ATC currently projects Mondesi to steal 42 bases in 2022, the highest of any player in the majors. His stolen base Z-Score equivalent in a standard 15-team 5x5 league is an enormous +5.50.
The problem is that if Adalberto gets injured in the first game of the season, your fantasy team will be severely lacking in stolen bases. For the rest of your fantasy roster, you certainly drafted fewer steals per roster slot, as you banked on Mondesi to carry the speed load. Therefore, one reason that Mondesi is a risky player - is that most of his fantasy value arises from one category alone.
IntraSD is a measure of how spread out a player’s value is over all of the categories. IntraSD is by no means a perfect metric. However, when you are your assembling fantasy rosters, the lower the aggregate IntraSD you can assemble, the less prone you are to upsetting your team’s 5×5 category balance in the event that something goes wrong. Planning contingencies is a major part of the fantasy game in 2022.
Below is the same NFBC ADP grid once again, but this time, players are colored by their ATC Intra-projection standard deviation (IntraSD). Low IntraSD figures are shaded in blue, while high IntraSD figures are shaded in orange.
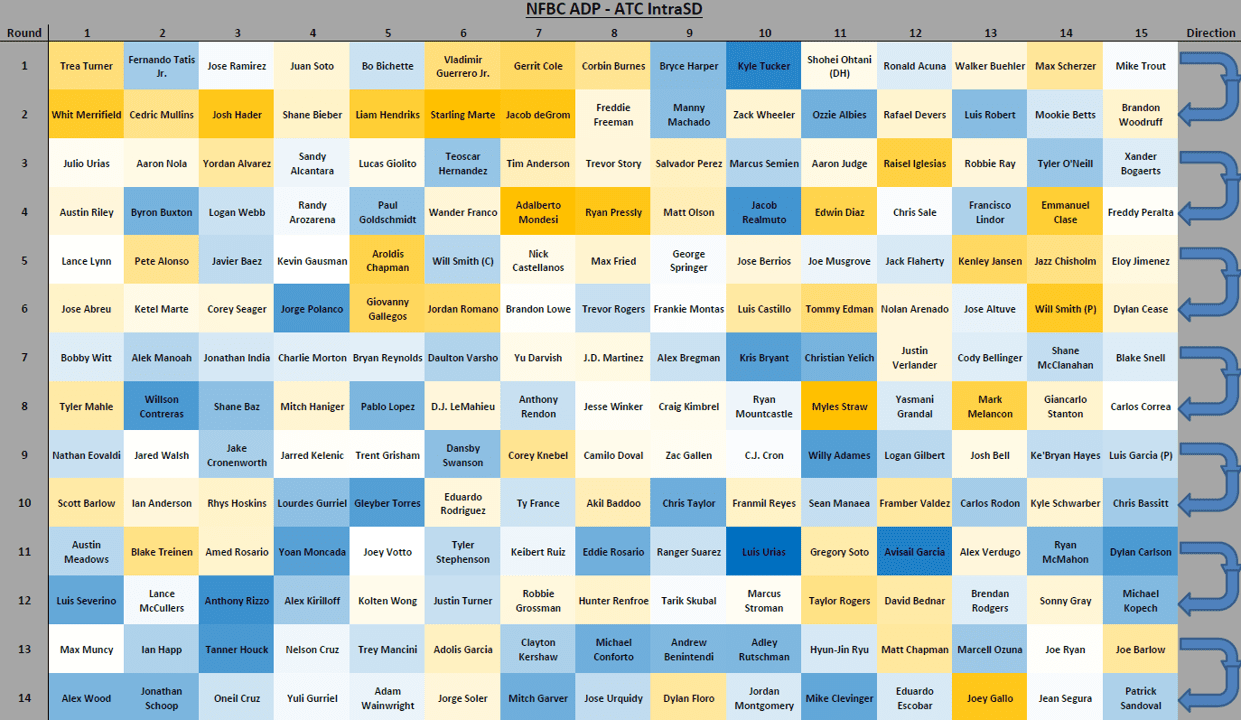
Click image to enlarge
IntraSD Player Notes – 1st Round
First, let’s briefly discuss the most well-rounded players categorically.
Kyle Tucker has the lowest IntraSD (0.22) of the first round. That is an extreme figure for a first-round player. Of course, we already saw that he also has a low InterSD, letting us know that Tucker is a player with far fewer risk factors than most. Bryce Harper has the second-lowest IntraSD at 0.47 – another categorically sound player.
On the high end, we have Trea Turner (1.43) and Vladimir Guerrero Jr. (1.42). I would caution those who wish to roster Vlad by using an early first-round selection – as he is only projected to steal three bases. That might leave drafters in a stolen base crunch throughout the draft (or force drafters to sacrifice value later on in order to push up steals). Trea Turner is less of a concern, as his power output is still strong.
Note that the highest 1.43 IntraSD in the first round this year is still a low IntraSD value. Drafters seem to be pushing up more well-rounded players … as they should.
Conclusion
As fantasy baseball players are well aware, there are a large number of factors to consider upon making roster decisions. A robust set of projections is certainly the largest tool that you can use in your arsenal. However, the raw projected values do not tell the full story about the player. To properly evaluate a player selection - one needs to compare his projected value, pit it against the market’s going price … and then risk-adjust their cost to arrive at your strike price.
To help us visualize the idea, fellow RotoBaller Jon Anderson helped provide yet another way to look at value versus risk. Below is a graph that he created that squares off ATC value, NFBC ADP, and InterSD.

At each ADP, one should favor players higher up on the ATC value scale – and give preference to those colored in green. Paul Goldschmidt and Max Kepler appear to be excellent buys using this methodology. You should be far more cautious with Lucas Giolito and Logan Webb.
With ATC and its projection volatility metrics, we now can get a better sense of some of the underlying risk factors for each player. The visual risk grids can help to paint more color for each player’s parameter and profile risk components. Throw these new weapons in your fantasy analysis toolbox.
Download Our Free News & Alerts Mobile App
Like what you see? Download our updated fantasy baseball app for iPhone and Android with 24x7 player news, injury alerts, sleepers, prospects & more. All free!

More Fantasy Baseball Advice