I can't believe it. Months of waiting, painful empty weekends, and now a quarter of the NFL season is suddenly gone! But I'm not going to lie, I love the moment when the whistle blows to end the week on Monday nights. It is just the confirmation that we have another full round of data in our hands, and for a nerd like me, that's great. For a reader that likes this type of content, you might feel the same.
To gain the biggest edge in your fantasy football league, it's a necessity to understand how to apply advanced statistics such as those being used in every sport nowadays. Back in the day, it was all about wins and losses, passing yards, and touchdowns scored. It is not that those stats are worthless, but they don't offer enough to the savvy analysts. While football is yet in its infancy in terms of analytics compared to baseball, the evolution the sport has seen lately in those terms is notable.
I'll be tackling NFL's Next Gen Stats on a weekly basis, bringing you the data from the just-completed week's games and highlighting some takeaways you should consider when assessing fantasy players for the upcoming games. In case you're new to the series, or Next Gen Stats altogether, I recommend you read our preseason primer. Now, it's time to get to the data!
Be sure to check all of our fantasy football rankings for 2025:- 2025 fantasy football rankings (redraft)
- Dynasty fantasy football rankings
- 2025 NFL rookie fantasy football rankings
- Best ball fantasy football rankings
- Quarterback fantasy football rankings
- Running back fantasy football rankings
- Wide receiver fantasy football rankings
- Tight end fantasy football rankings
Passing Stats Don't End In Plain Completions
After covering running back and receiver statistics during the first two weeks of the season, I took on the task of looking at quarterbacks for the Week 3 games. By this time, you know how it goes. It is all about Air Yards, over- and under-performing players, and underlying numbers that tell more about the game than your old times' basic metrics.
Last week, I focused mostly on Completion Percentage (COMP%) and Expected Completion Percentage (xCOMP). With those two values, we are able to know how quarterbacks are doing when throwing the ball, and also how they should have done in comparison to a set of historical data. If you think a bit about it, you'd realize that to complete a pass a quarterback needs a partner, namely a wide receiver, tight end, or running back on receiving duties. The ability of those players will undoubtedly impact the quarterback's completion percentages.
By "ability", I'm not just referring to their hands and their catching prowess. That is what counts at the end of the play, sure, but for the play to happen you have to take into consideration the rest of the receiver skillset: the speed, the acceleration, the route-running, etc. All of that is what really builds each player's profile. There are guys limited to play in the slot and run short routes. There are wideouts that can burn any cornerback down the sideline to get huge chunks of yardage. That's the beauty of the game.
As a final entry before moving back to studying stats related to wide receivers and running backs, I wanted to take a second look at quarterbacks this week. While analyzing them after Week 3 I found some interesting numbers that were left out of the last article, so now is the time to look at them before moving on. I will explain the new metrics in their corresponding sections.
Does More Time Equal Better or Worse Results? Neither
There is a metric provided by the NFL called Time to Throw (TT). It is what it sounds like: the seconds elapsed since the snap to the moment the quarterback throws the ball to a receiver. I don't know what you have in mind regarding this measure. Maybe you think quick throws are better because the defense doesn't have time to react. Maybe you think taking more time to throw is worse because receivers finish their routes and then they have to improvise what to do next. Or maybe you think in a completely opposite way.
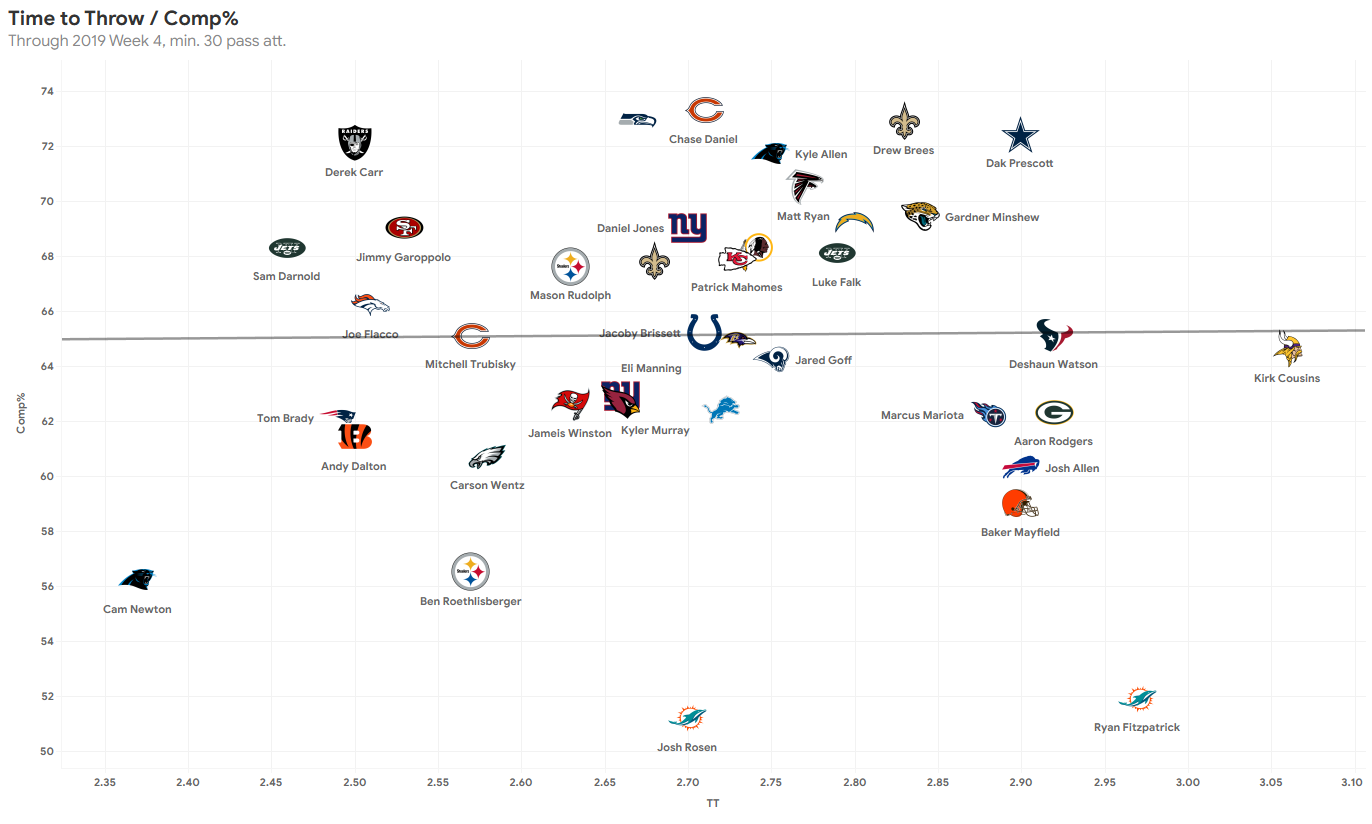
In any case, let's take a glance at the relation between TT and COMP%, just to see if there is any relation between both stats:

That, at best, is a big old mess. There is just virtually no relation between TT and COMP%. Congratulations to Kirk Cousins on his day-long throws, as much as to Cam Newton for his rapid-fire shots. No matter the style of play, or the time taken to toss the pigskin, COMP% has nothing to do with it.
Also, as you can see, TT variance moves in tenths of seconds on average when we consider all passing attempts. It is not that one quarterback takes four seconds to throw while other fires in just under three ticks. The difference isn't that big.
Waiting For The Big Throw
In order to give some fantasy-related notes about TT, it is better to put it next to our beloved Air Yards. To do that we have two metrics provided by the NFL for quarterbacks: Completed Air Yards (CAY) and Intended Air Yards (IAY).
The first number, CAY, shows the average Air Yards the passer throws on completions.
The second, IAY, shows the average Air Yards the passer throws on all attempts, no matter if the ball is caught or not. These two metrics allow us to know how far downfield the ball is being thrown on average by a quarterback, and negative values mean that the QB is throwing behind the Line of Scrimmage.
Finally, Air Yards Differential (AYD) simply subtracts the IAY from the CAY to see if the QB is on average attempting deep passes than he on average completes.
These are your leaders and trailers in TT, next to their CAY, IAY, and AYD numbers through Week 4:
| Player | Team | TT | CAY | IAY | AYD |
| 1. Kirk Cousins | MIN | 3.1 | 5.4 | 7.0 | -1.6 |
| 2. Ryan Fitzpatrick | MIA | 3.0 | 8.1 | 12.2 | -4.0 |
| 3. Deshaun Watson | HOU | 2.9 | 6.7 | 9.8 | -3.1 |
| 4. Aaron Rodgers | GB | 2.9 | 6.1 | 8.1 | -2.0 |
| 5. Dak Prescott | DAL | 2.9 | 7.5 | 9.5 | -2.0 |
| 6. Josh Allen | BUF | 2.9 | 6.5 | 10.0 | -3.5 |
| 7. Baker Mayfield | CLE | 2.9 | 6.5 | 8.5 | -2.0 |
| 35. Derek Carr | OAK | 2.5 | 4.7 | 6.2 | -1.6 |
| 36. Andy Dalton | CIN | 2.5 | 5.4 | 7.1 | -1.7 |
| 37. Tom Brady | NE | 2.5 | 6.2 | 8.0 | -1.8 |
| 38. Sam Darnold | NYJ | 2.5 | 2.3 | 5.6 | -3.3 |
| 39. Cam Newton | CAR | 2.4 | 6.8 | 8.4 | -1.6 |
Although the table might not be clear if you're not familiar with those metrics, there are names and numbers expected in it. Take Ryan Fitzpatrick, for example. He is known as an all-or-nothing quarterback. That explains why he has the second-largest TT in the league, as he waits for his receivers to go deep before throwing them passes, as is explained by his even bigger IAY. Another gunslinger is Josh Allen, whose 10.0 IAY ranks fifth in the league. On the other hand, quick throwers like Sam Darnold (2.5 TT on average) don't wait for routes to develop much and rely on short passes (Darnold's 5.6 IAY are the second-fewest in the league).
Again, a quick plot could make things easier to understand when talking about CAY and IAY:

Here are some other notes we can get from this data:
- By this time we all know Minnesota's offense is, well, kind of bad in the passing game. Kirk Cousins is actually taking the most time to throw the ball, yet his IAY is the 10th-lowest among quarterbacks with at least 30 attempts. Taking all that time to gain such low yardage can only mean pressure and potential hits and sacks coming Cousins' way.
- Marcus Mariota didn't make the 2.9 TT cut in the table above, but just barely. With a TT of 2.88, though, Mariota is the only active starter with an AYD over minus-1 (6.8 CAY, 7.6 IAY, -0.9 AYD). This means he's throwing moderately long passes all of the time and his completions are usually pretty close to that depth, which makes him a secure passer in that he seems to know what he's aiming for.
- Josh Rosen and Ryan Fitzpatrick, both Miami quarterbacks, look to be trying too hard. Their AYD is -3.8 and -4.0, both league-lowest if we don't count Ben Roethlisberger's (out for the year).
- Although Joe Flacco is close to Mariota in AYD (-1.2 to -0.9), Flacco's intended pass fly 6.4 yards on average, while Mariota's average completed pass is at a higher 6.8 yards. We all knew Flacco never was a sexy proposition at the helm.
- As you can see, rookies, backups, and plain bad players (hello, Mitch Trubisky!) are on the bottom-left corner of the plot. Those players tend to go for the safest pass. They rely on short routes and usually look for checks to their running backs, sure throws to tight ends, or slant routes from the slot WR.
Enough Times! Who Is Throwing Where and How Effectively?
Okay, okay, I understand it's been a plethora of new stuff up to this point and you need to process it calmly. So for this last part of the article, I'm going with something a little more familiar and easier to understand. The last two metrics I'm going to show you today are straightforward.
First, we have Air Yards to the Sticks (AYTS). AYTS measures the Air Yards ahead or behind the first down marker on all attempts for a passer.
Second, there is the Aggressiveness (AGG%) of a quarterback, which tracks the rate of passes that are thrown into tight coverage (defenders within one yard of the target whether the pass is completed or incompleted).
Both of these metrics can provide useful information when assessing quarterbacks and making fantasy decisions. Depending on your profile as a fantasy player and GM, you might prefer players that walk the safe path over those that tend to air the ball out looking for big gains. In the same vein, you might prefer to roster someone that always goes for the high-upside with risky passes instead of your average Joe Flacco two-yard sure-completions quarterback.
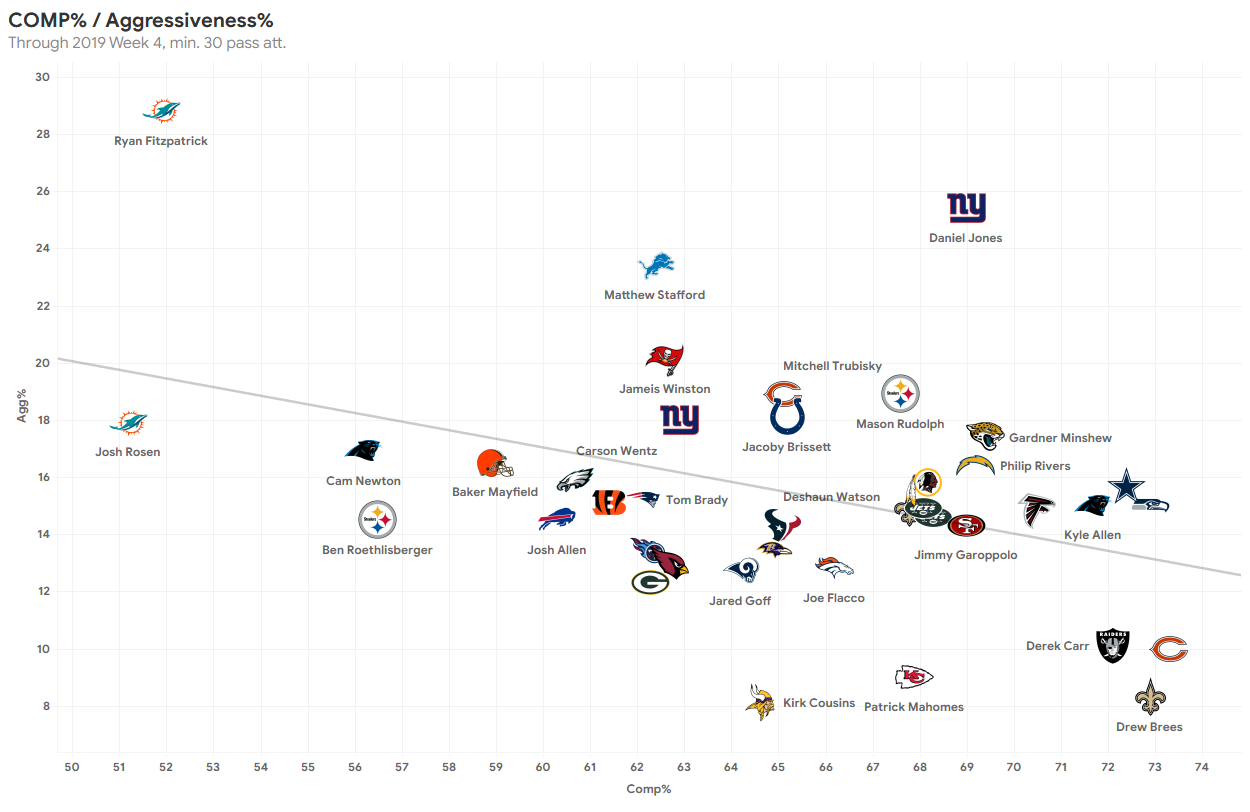
Here is a simple chart visualizing how AGG% and COMP% are related among qualified QBs through Week 4:

If you have been following the NFL for a while, you must agree this chart definitely passes the eye test. At the top of it, we have the most aggressive passers, who either don't care to throw into tight windows or air balls deep downfield making their receivers catch the ball while tightly covered by cornerbacks. At the bottom, we have our beloved boring quarterbacks, and Patrick Mahomes, who is from another world and needs a category on his own. Completion percentage is easy to figure out: left side means worse passers, right side for the better passers, at least during the first quarter of the season. Here are some interesting takeaways:
- No matter if you like aggressiveness or not, Miami quarterbacks aren't completing passes one way or the other. This is obvious, but yes, fade them, drop them, cut them, and do whatever you can to not have them in your roster, let alone your lineup.
- Although Baker Mayfield isn't being overly aggressive, his completion rate so far is dubious at best. He will need to step up his game if he wants to put the Browns at the height of preseason expectations. At this point, he's no more than a streaming option, given the talent of his receivers yet how bad he's using them.
- Matthew Stafford and Jameis Winston, although not weekly starters in your lineup neither, are putting up good performances. Both of them offer high upside, but you also know one or two interceptions can be on schedule for them every game.
- While Kirk Cousins is the least-aggressive player in the league, he ranks 23rd in COMP%. He's been plain bad. He's not risking anything, and even with that he's missing receivers. Minnesota's passing game offers no gain to owners and it is starting to make me think it's not too early to sell both Stefon Diggs and Adam Thielen.
- Both Russell Wilson and Dak Prescott have been really good, perhaps the most efficient quarterbacks in 2019. They are throwing balls at an average AGG%, and rank second and fourth in COMP%, both over 72%. They should already be owned, but if for some reason you can get any of them via trade you'd better do!
- Although in short samples, Gardner Minshew and Daniel Jones have looked pretty nice. Jones profiles as a risk-it-all player with a 25.4% aggressive passes, but still completing them at a 69% rate. Minshew, on the other hand, has a virtually equal COMP% of 69.4 yet he's kept the bombs at home, throwing just 17.4% aggressive passes.
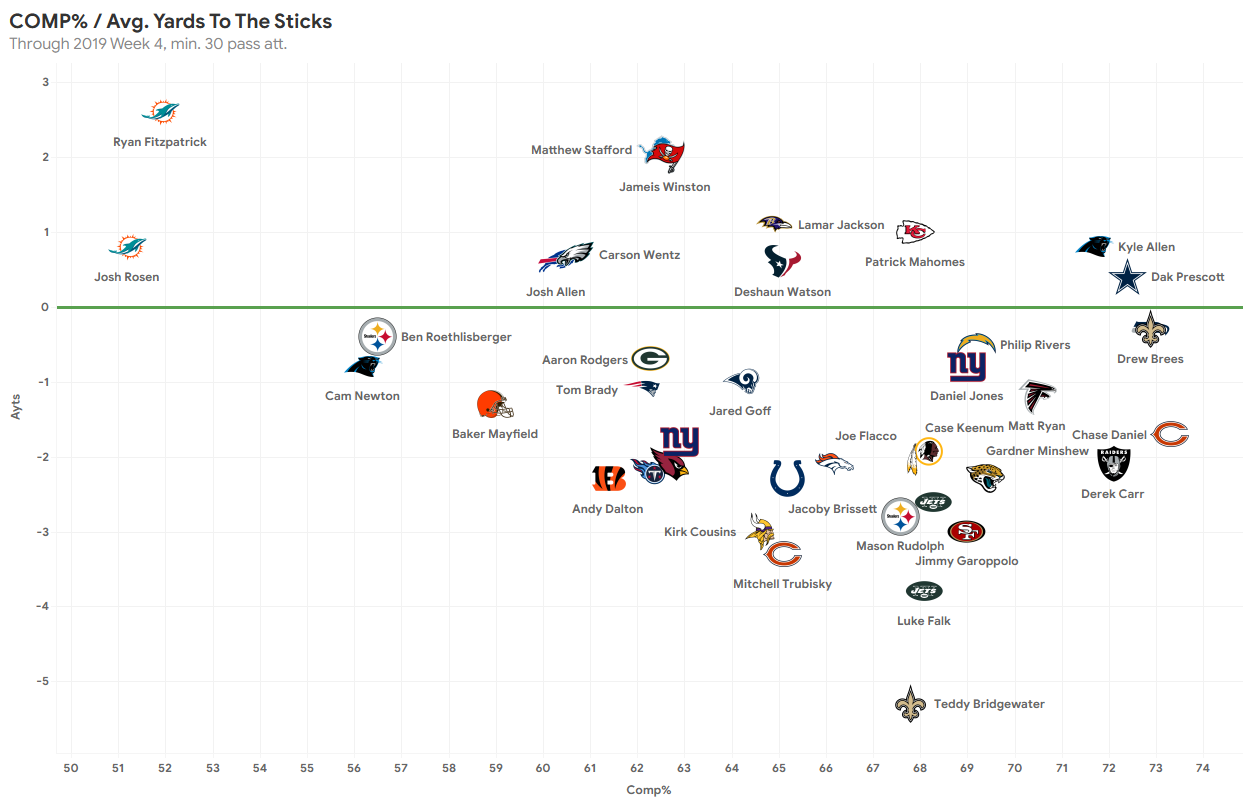
Finally, I'd like to take a look at how COMP% and AYTS compare to each other. The first thought that comes to your mind when thinking of those two metrics together is simple: shorter passes should equal higher completion rates. You're correct. That's the theory, and what should be expected. If any quarterback is constantly throwing short passes and missing them, something is wrong. Here is how this season's qualified QBs are doing so far (the green line represents the first down marker):

This is perhaps the most telling chart and information of all shown here this week. Remember when we discovered rookies and backups tend to throw safe, short passes? It shows here, as most of them are at the bottom of the chart. At the top, those that always go for the boom-or-bust play and the first down no matter what. Here are some fantasy-related insights:
- The New Orleans Saints will be relieved when Drew Brees comes back in a few weeks. Teddy Bridgewater is usually more than five yards short of the first down marker and often relies on Alvin Kamara to do the heavy work. That could end up burning out the running back, so keep an eye on him to see if he drops his production, and don't put too much stock on Teddy as his outcomes are built around what the rest of the offensive players can help him get.
- Andy Dalton may be in a bit of a surprising position in the chart. We tend to put him in the booming category of quarterbacks, and he has already had three 250-plus yards games, yet he throws two yards short of the 1D on average. With A.J. Green out indefinitely and now the injury of John Ross (expected to miss a month), Dalton might struggle to get fantasy points weekly if the receivers can't catch everything and extend the plays.
- Kirk Cousins and Mitchell Trubisky are a little worrying (as if we didn't know already). They have middling COMP% rates while throwing really short passes. Basically, no upside from their game and pure dependence on what their receivers do once they catch the ball.
- Lamar Jackson and Patrick Mahomes are roster-locked in your league already. They are a couple of beasts, throwing constantly over the 1D marker and completing passes at a 65% and 68% clip respectively. Close to them, Deshaun Watson has similar numbers in both metrics and although it will be hard, it is possible you can strike a deal for him if he put on a dud in some of the coming weeks. You'll be getting quite a stud.
Conclusion
That's it for today. After two weeks analyzing quarterbacks and their traits, it's time to move on and focus on the receiving and rushing part of the game going forward in the NextGenStats series. We've covered pretty much all the information available and provided by the NFL with regards to game callers, so we'll leave them to work for a couple of weeks and come back to them in a while.
Yes, we've already consumed one-quarter of the season, but be positive. We still have plenty of weeks ahead to crunch the numbers and try to get an edge over the rest of fantasy GMs to beat them on our way to the chip. Keep fighting!
 RADIO
RADIO


