RADIO
RADIO


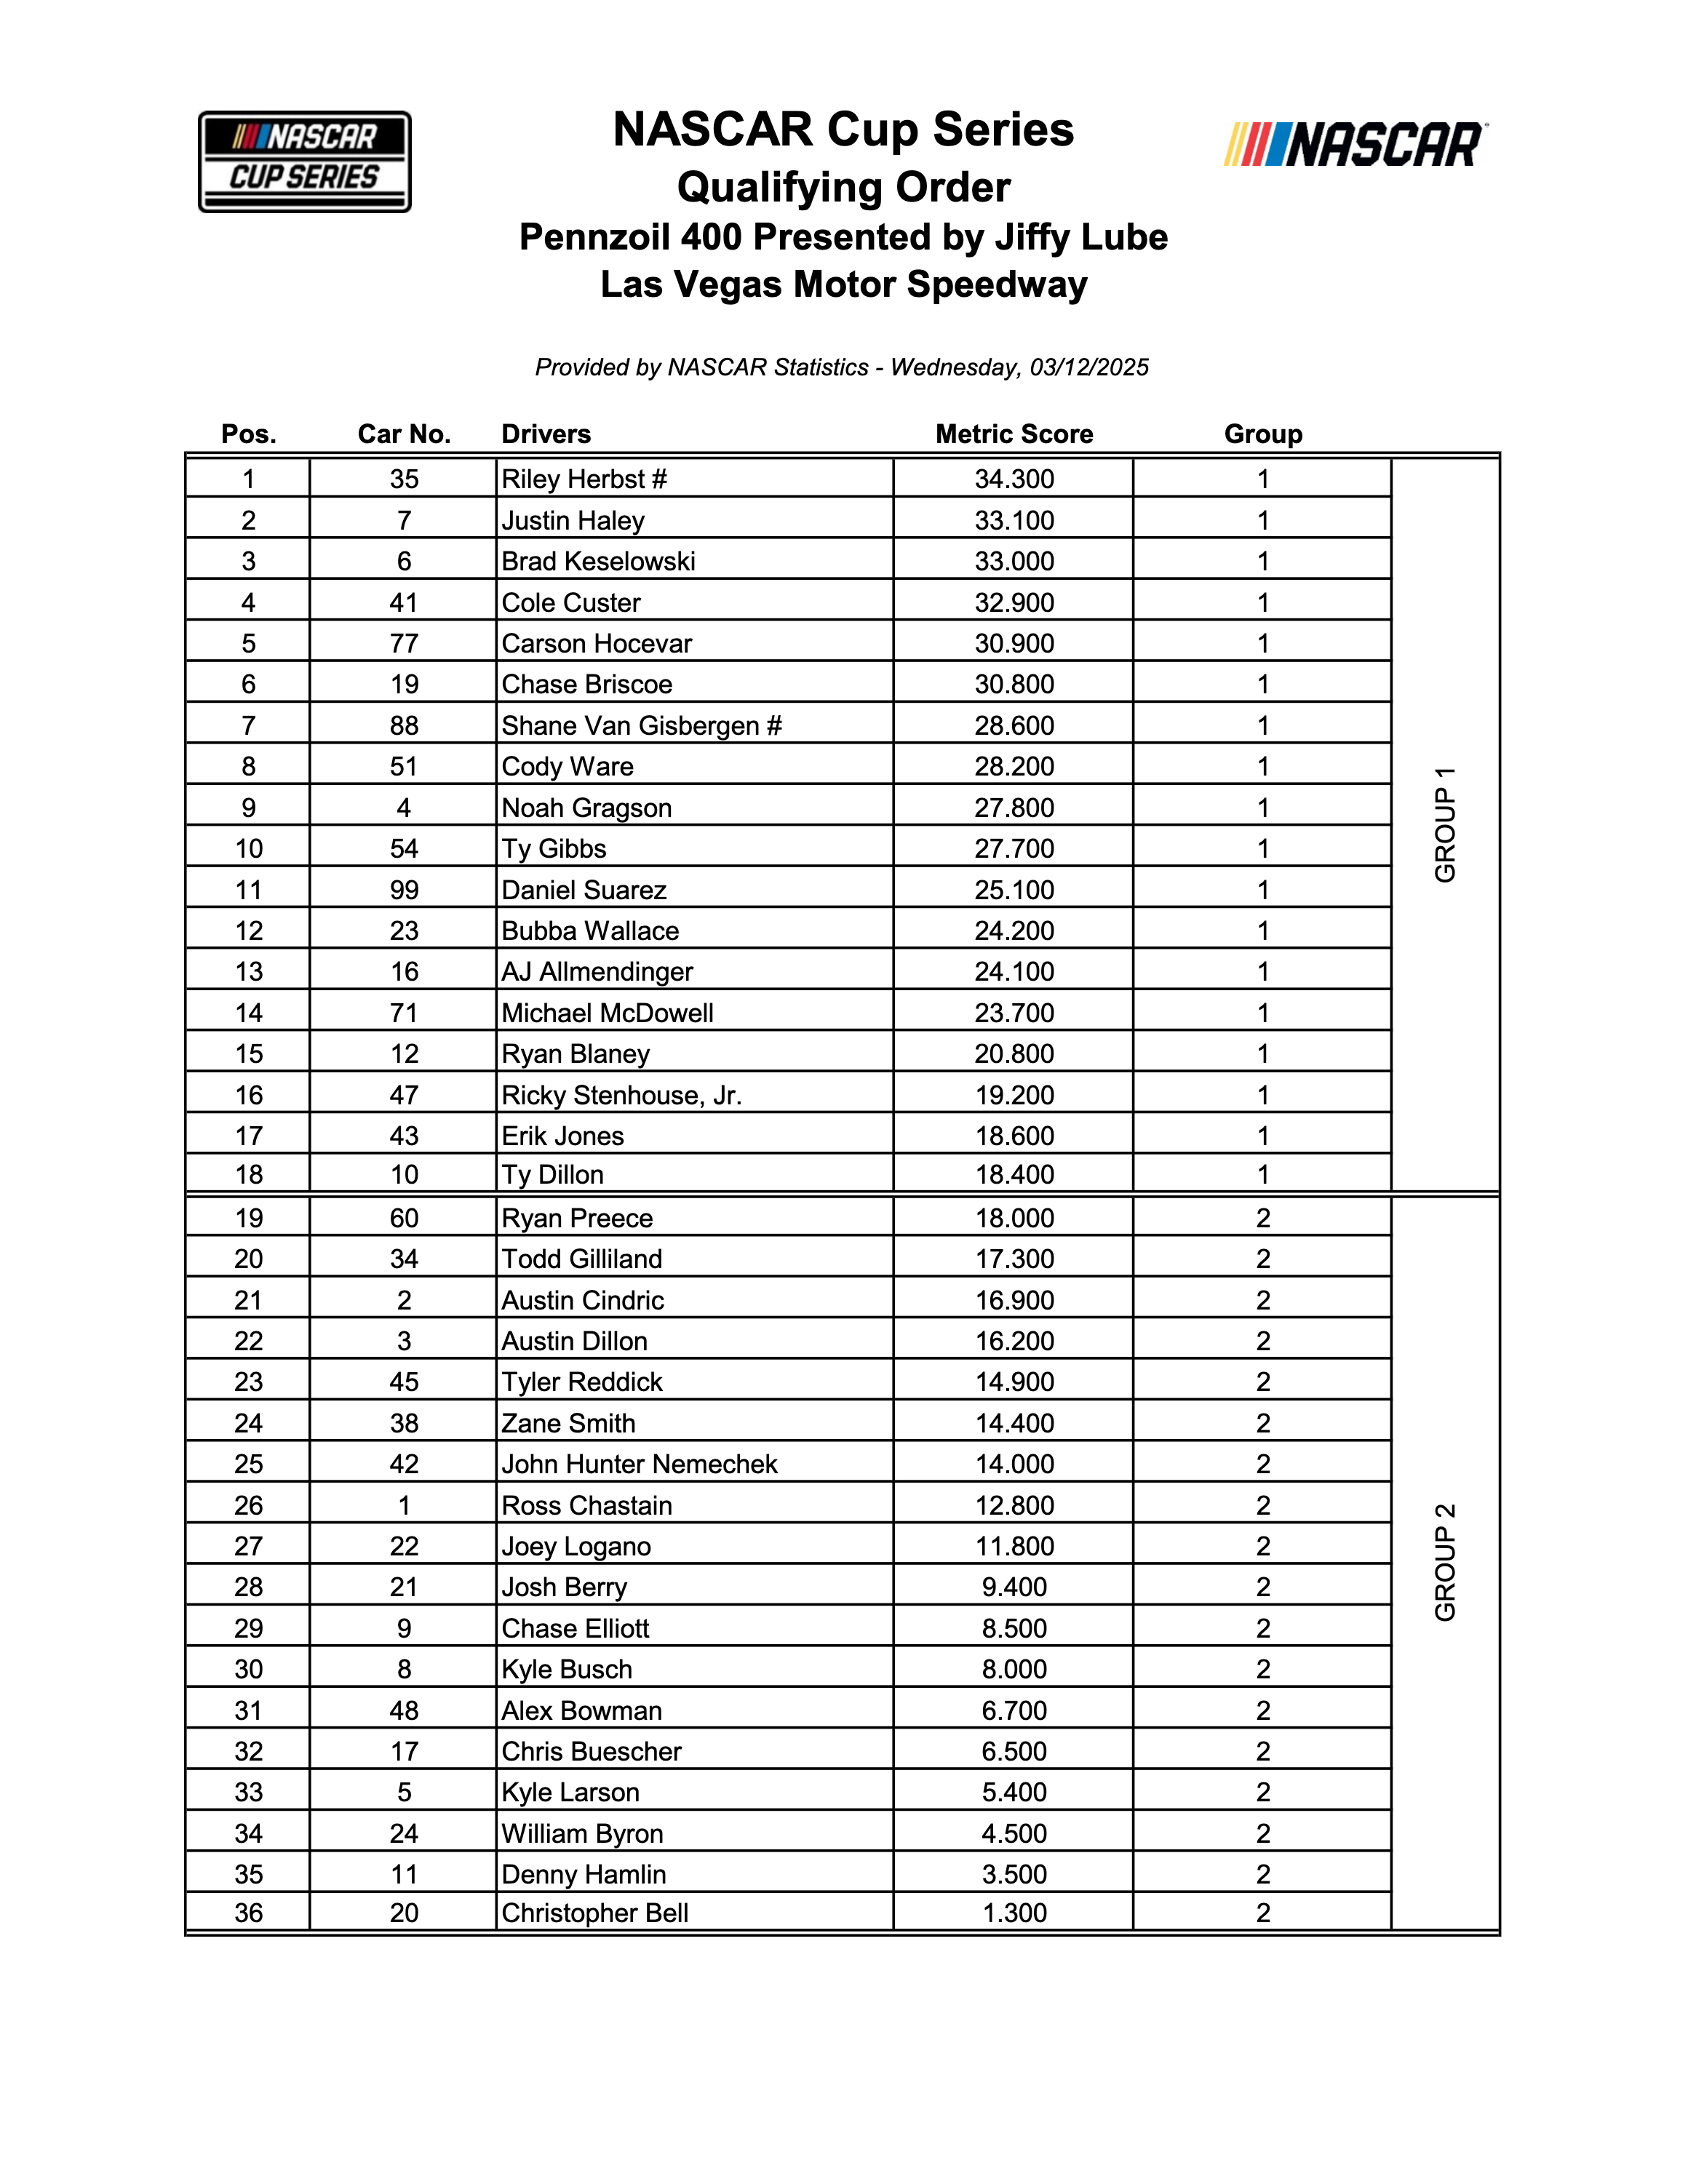
The NASCAR Cup Series ran a single practice session at Las Vegas Motor Speedway on Saturday afternoon in preparation for the upcoming Pennzoil 400 on Sunday afternoon.
The 36-car field was split in to two groups for practice, with each group getting just 25 minutes on track. The announcer booth thought that the first group had a speed advantage due to the track being green when their first went out, but that didn't end up being the case.
Below you will find the two groups, key notes from the practice session, as well as the practice speeds for all drivers.
Important Practice Notes
Ryan Blaney - About 15 minutes into the first group's session, Ryan Blaney blew a right rear tire and spun out, backing his No. 12 Ford into the wall. Blaney's team assessed the damage and determined that it was fixable and they didn't need to go to a backup car.
Ross Chastian - The No. 1 Chevrolet was super fast in practice on Saturday afternoon. Chastain laid down a single lap over two tenths of a second faster than the rest of the field, and had the best 20-lap average as well.
William Byron - About 15 minutes in into the second group's session, William Byron brought his No. 24 Chevrolet onto pit road, complaining of a vibration. Crew chief, Rudy Fugle, had the team look at the car and determined there was nothing to worry about. It may have been cautionary after what happened to Blaney in the first group.
2025 Las Vegas Pennzoil 400 Practice Speed Chart
Click here to download the PDF of the practice speed chart.
| Pos | Driver | Time | Speed | Fastest Lap | Laps Run | Behind Leader |
| 1. | Ross Chastain | 28.747 | 187.846 | 2 | 27 | ---.--- |
| 2. | Bubba Wallace | 28.987 | 186.290 | 2 | 23 | -0.240 |
| 3. | William Byron | 29.005 | 186.175 | 4 | 22 | -0.258 |
| 4. | Kyle Larson | 29.035 | 185.982 | 2 | 30 | -0.288 |
| 5. | Austin Dillon | 29.080 | 185.695 | 2 | 21 | -0.333 |
| 6. | Noah Gragson | 29.117 | 185.459 | 3 | 30 | -0.370 |
| 7. | Chase Elliott | 29.121 | 185.433 | 3 | 32 | -0.374 |
| 8. | Christopher Bell | 29.134 | 185.350 | 4 | 28 | -0.387 |
| 9. | Michael McDowell | 29.152 | 185.236 | 3 | 35 | -0.405 |
| 10. | Chris Buescher | 29.188 | 185.008 | 3 | 24 | -0.441 |
| 11. | Kyle Busch | 29.209 | 184.875 | 3 | 29 | -0.462 |
| 12. | Carson Hocevar | 29.213 | 184.849 | 3 | 25 | -0.466 |
| 13. | Tyler Reddick | 29.235 | 184.710 | 4 | 25 | -0.488 |
| 14. | Alex Bowman | 29.244 | 184.653 | 4 | 25 | -0.497 |
| 15. | Erik Jones | 29.247 | 184.634 | 2 | 28 | -0.500 |
| 16. | Justin Haley | 29.251 | 184.609 | 3 | 28 | -0.504 |
| 17. | AJ Allmendinger | 29.269 | 184.496 | 3 | 20 | -0.522 |
| 18. | Daniel Suarez | 29.271 | 184.483 | 3 | 32 | -0.524 |
| 19. | Chase Briscoe | 29.334 | 184.087 | 5 | 34 | -0.587 |
| 20. | Joey Logano | 29.387 | 183.755 | 3 | 37 | -0.640 |
| 21. | Austin Cindric | 29.407 | 183.630 | 3 | 39 | -0.660 |
| 22. | Cole Custer | 29.453 | 183.343 | 2 | 23 | -0.706 |
| 23. | Riley Herbst | 29.468 | 183.250 | 2 | 29 | -0.721 |
| 24. | Zane Smith | 29.485 | 183.144 | 3 | 25 | -0.738 |
| 25. | Ty Gibbs | 29.486 | 183.138 | 5 | 32 | -0.739 |
| 26. | Brad Keselowski | 29.505 | 183.020 | 5 | 21 | -0.758 |
| 27. | Ricky Stenhouse Jr. | 29.527 | 182.883 | 3 | 33 | -0.780 |
| 28. | Ryan Blaney | 29.605 | 182.402 | 11 | 18 | -0.858 |
| 29. | Denny Hamlin | 29.605 | 182.402 | 4 | 39 | -0.858 |
| 30. | John Hunter Nemechek | 29.618 | 182.322 | 4 | 30 | -0.871 |
| 31. | Ryan Preece | 29.704 | 181.794 | 4 | 30 | -0.957 |
| 32. | Josh Berry | 29.807 | 181.165 | 5 | 38 | -1.060 |
| 33. | Shane Van Gisbergen | 29.838 | 180.977 | 5 | 35 | -1.091 |
| 34. | Cody Ware | 29.861 | 180.838 | 2 | 17 | -1.114 |
| 35. | Ty Dillon | 29.897 | 180.620 | 6 | 27 | -1.150 |
| 36. | Todd Gilliland | 29.908 | 180.554 | 3 | 22 | -1.161 |
2025 Las Vegas Pennzoil 400 10-Lap Average Chart
| Pos | Driver | From Lap | To Lap |
Avg Speed
|
| 1. | Ross Chastain | 1 | 10 | 184.130 |
| 2. | William Byron | 2 | 11 | 183.840 |
| 3. | Bubba Wallace | 1 | 10 | 183.473 |
| 4. | Tyler Reddick | 2 | 11 | 183.320 |
| 5. | Alex Bowman | 2 | 11 | 183.294 |
| 6. | Kyle Larson | 1 | 10 | 183.286 |
| 7. | Kyle Busch | 1 | 10 | 183.071 |
| 8. | Erik Jones | 1 | 10 | 183.001 |
| 9. | Christopher Bell | 1 | 10 | 182.911 |
| 10. | Carson Hocevar | 2 | 11 | 182.819 |
| 11. | Chase Elliott | 2 | 11 | 182.726 |
| 12. | Noah Gragson | 2 | 11 | 182.635 |
| 13. | Justin Haley | 1 | 10 | 182.620 |
| 14. | Michael McDowell | 1 | 10 | 182.548 |
| 15. | Austin Cindric | 1 | 10 | 182.282 |
| 16. | Chris Buescher | 1 | 10 | 182.276 |
| 17. | Ryan Blaney | 5 | 14 | 182.003 |
| 18. | Daniel Suarez | 1 | 10 | 181.860 |
| 19. | Joey Logano | 1 | 10 | 181.851 |
| 20. | Chase Briscoe | 1 | 10 | 181.596 |
| 21. | Ricky Stenhouse Jr. | 3 | 12 | 181.551 |
| 22. | Denny Hamlin | 2 | 11 | 181.544 |
| 23. | Zane Smith | 1 | 10 | 181.385 |
| 24. | John Hunter Nemechek | 1 | 10 | 181.005 |
| 25. | Ty Gibbs | 1 | 10 | 180.990 |
| 26. | Cole Custer | 1 | 10 | 180.949 |
| 27. | Riley Herbst | 1 | 10 | 180.766 |
| 28. | AJ Allmendinger | 11 | 20 | 180.518 |
| 29. | Brad Keselowski | 9 | 18 | 180.390 |
| 30. | Josh Berry | 1 | 10 | 180.041 |
| 31. | Ryan Preece | 2 | 11 | 180.037 |
| 32. | Shane Van Gisbergen | 17 | 26 | 178.854 |
| 33. | Todd Gilliland | 6 | 15 | 178.303 |
NASCAR DFS News and Driver Outlooks
More Fantasy NASCAR Analysis
The Keys to Weekly NASCAR Success
NASCAR is back, and it's time for you to win more with RotoBaller! Our NASCAR Premium Package for DFS and betting features several heavy hitters and proven winners.
Jordan McAbee anchors the team with his exclusive NASCAR DFS and betting picks, DFS projections and algorithm-predicted finishing order! Jordan had a 60+ unit betting profit in 2024 NASCAR, and a 25% average annual profit since 2018. He won the FSWA Racing Writer Of The Year award in 2023, and has been nominated for DFS Writer Of The Year in 2024.
Five-time NASCAR Racing Writer of the Year finalist and fantasy industry legend Scott "The King" Engel is also in the crew, bringing you his weekly strategies and lineup picks. Set your winning DFS lineups with our award-winning team. He has been nominated once again in 2024 for this award.