


 RADIO
RADIO


What are ballpark factors, and how do they impact fantasy baseball outlooks? Definition and meaning of ballpark factors as part of our sabermetrics glossary.
Welcome RotoBallers to our overview of ballpark factors. This article is a deeper dive into ballpark factors and is part of our ongoing series "Using Sabermetrics for Fantasy Baseball."
In this article, we'll explore how unique MLB parks influence a player's performance for fantasy purposes. Most people associate ballpark factors with home runs, but we'll look at how and why stadiums affect virtually every number fantasy managers care about.
You can find our entire sabermetrics glossary, which includes links to many other sabermetric stats as part of this series. Each stat deep dive will be released over the next few days. Stay tuned!
Be sure to check all of our fantasy baseball lineup tools and resources:- Fantasy baseball trade analyzer
- BvP matchups data (Batter vs. Pitcher)
- PvB matchups data (Pitcher vs. Batter)
- Who should I start? Fantasy baseball comparisons
- Daily MLB starting lineups
- Fantasy baseball closer depth charts
- Fantasy Baseball live scoreboard
- Fantasy baseball injury reports
What Are Ballpark Factors? Sabermetrics Glossary
If you have ever selected a streamable pitcher based on a home park or benched an otherwise must-start arm at Coors Field, you already know how much a stadium can impact a player's bottom line.
Ballpark factors quantify the influence each stadium has, allowing you to make the most of your fantasy team's real-life schedule. However, the math involved is approximate, and random fluctuations in weather patterns and sheer dumb luck can make the same parks play very differently yearly.
Ballpark factors are available from various sources, including Baseball Savant (Statcast), ESPN, Baseball Prospectus, and FanGraphs. Many of them look intimidating at first glance. Here are Statcast's ballpark factors for 2022-2024:
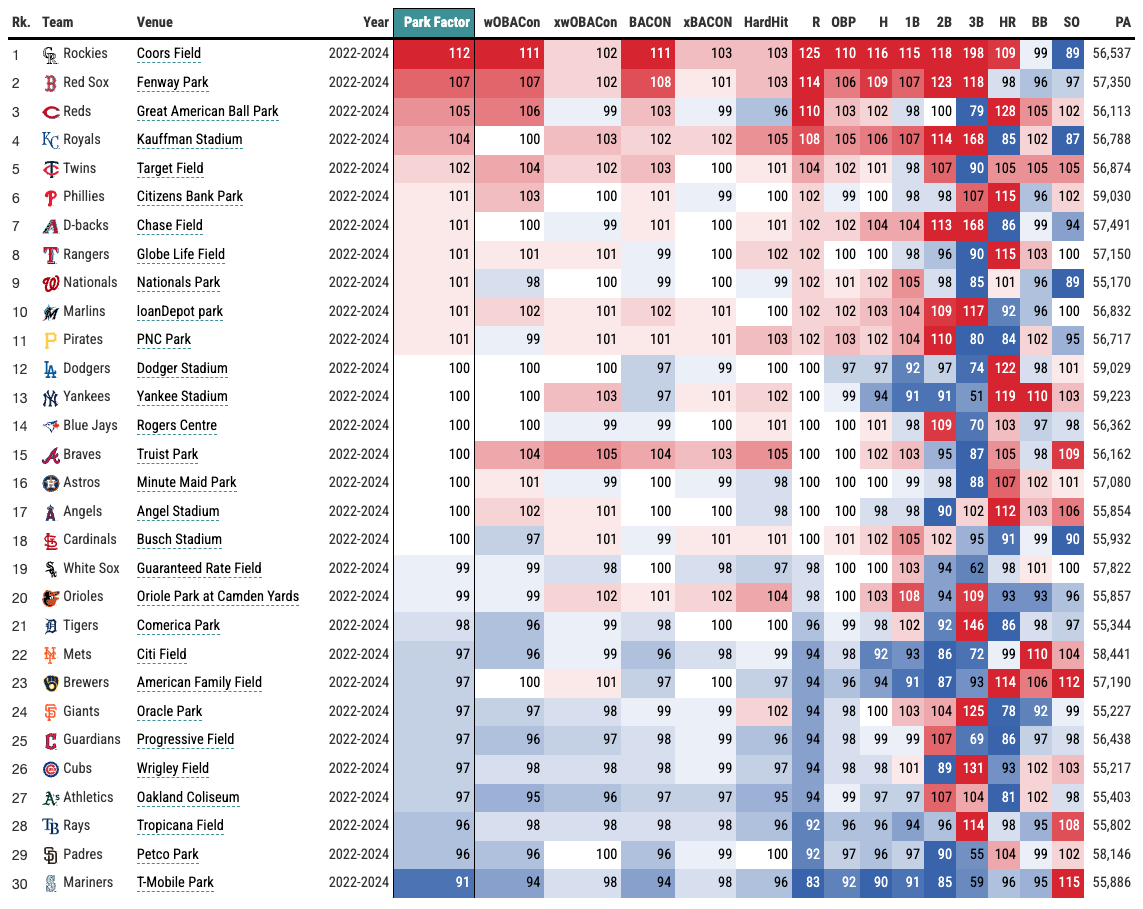
Luckily, interpreting ballpark factors isn't as complicated as the chaos above suggests.
How to Interpret Ballpark Factors
Ballpark factors are generally set to a base of 100 (or 1.000, which doesn't change anything), meaning that a park factor of 100 plays perfectly neutral. Factors greater than 100 signify that a given park allows more of that outcome, while numbers below 100 represent less of those outcomes.
Each source calculates its numbers differently, but they all use the base-100 scale listed above. There is no "correct" factor to use, as each system has merits. Just make sure you stick to a single source for any analysis to control for variance.
Your chosen source also dictates how much each point above or below 100 is "worth." A player only plays 50 percent of his games at home, with the rest of his schedule comprised of road games.
Some sources, such as FanGraphs, halve all of their factors to accommodate this, making each point above or below 100 represent a one percent increase or decrease over a full season of stats. Other sources leave that to you.
If that's too confusing, it's fine to forget it. Just remember that a park factor of 110 is considerably higher than a 105 mark. It's also important to note that ballpark factors aren't everything. If a particular park has a runs factor of 99, that isn't a strong enough argument to stream a pitcher there, among other compelling reasons.
Long Ball Hunting
When most fantasy managers think of ballpark factors, they think of homers. A park allowing plenty of bombs is viewed as a hitter's park, while parks allowing fewer dingers are more pitcher-friendly. In truth, this approach is too simplistic, even if you only care about home runs.
The home of the Cincinnati Reds is known as a home run haven for good reason. From 2022-2024, the stadium had a Statcast HR factor of 119 for right-handed batters and 142 for left-handed swingers. The stadium helps power hitters regardless of which side of the plate they swing from, though lefties get a bigger boost.
In contrast, Philadelphia's Citizen's Bank Park posted a 106 HR factor for righties but a 127 for lefties, meaning the park favored left-handed sluggers by a considerable margin. Platoon splits matter when interpreting ballpark factors.
While most fantasy managers are familiar with certain ballparks allowing more or fewer homers than others, BABIP is an under-appreciated component of ballpark factors. Altitude, infield conditions, foul territory, the batter's eye, and the size of the stadium can all influence how a ballpark plays beyond just home runs.
The Colorado Rockies managed a .332 BABIP at home in 2024 against a road BABIP of .282. They post a similar split every season, so that performance was no fluke. Players tend to perform better at home, but Colorado's splits indicate more than that.
Indeed, Coors Field promoted more singles (115 per Statcast), doubles (118), triples (198), and homers (109) than the average park from 2022-2024. The sample size of triples is usually too small to mean anything, but Coors Field has many quirks to help explain its extreme tendencies.
It's a gigantic ballpark, offering plenty of real estate for balls to find grass. Breaking balls behave differently due to Denver's elevation, removing some pitching weapons. Fatigue may set in faster for the same reason.
The introduction of the humidor has decreased the ballpark's HR rates compared to the height of the Steroid Era, but it still consistently posts the highest BABIPs in baseball. For this reason, fantasy gamers should generally be skeptical of Colorado hurlers.
Colorado is the most extreme example, but every stadium has some quirk that makes it unique. Fenway's Green Monster, Yankee Stadium's short porch, and Wrigley's wind can all affect a player's fantasy stats.
That said, sometimes ballpark factors can lie. 81 games are a relatively small sample size, so a park could play dramatically differently in a given season than it has in the past or should be expected to move forward. Some ballpark factors come in three-season or five-season variants to attempt to filter out some of this noise, but it's still something to consider in your analysis.
Of course, ballpark changes overwhelm these considerations. The Orioles are modifying the dimensions at Camden Yards this year, so we shouldn't expect it to be as pitcher-friendly as it appeared from 2022-2024.
Conclusion
Ballpark factors quantify how much influence a player's environment has on his final totals. A 100 factor is league-average, with numbers above or below that indicative of more or fewer events. Most fantasy managers think of homers when considering park factors, but singles, line drives, and even strikeouts are affected, too. Platoon splits also matter a lot.
Download Our Free News & Alerts Mobile App
Like what you see? Download our updated fantasy baseball app for iPhone and Android with 24x7 player news, injury alerts, sleepers, prospects & more. All free!

More Sabermetrics & Statcast for Fantasy Baseball